
XAG/USD: technical analysis
23 January 2019, 11:00
| Scenario | |
|---|---|
| Timeframe | Weekly |
| Recommendation | BUY STOP |
| Entry Point | 15.55 |
| Take Profit | 15.80, 16.05 |
| Stop Loss | 15.35 |
| Key Levels | 14.90, 15.00, 15.18, 15.55, 15.80, 16.05 |
| Alternative scenario | |
|---|---|
| Recommendation | SELL STOP |
| Entry Point | 15.18 |
| Take Profit | 15.00, 14.90 |
| Stop Loss | 15.30 |
| Key Levels | 14.90, 15.00, 15.18, 15.55, 15.80, 16.05 |
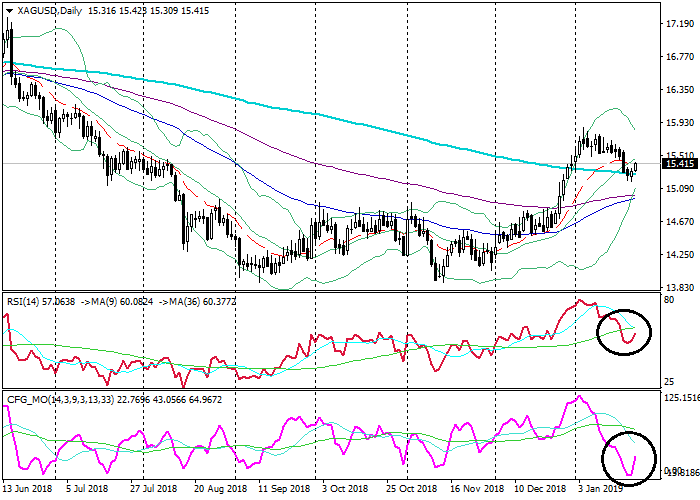
XAG/USD, D1
On the daily chart, the instrument is trading on the middle MA of the Bollinger Bands. The price remains above its moving averages that start turning up. The RSI is about to test from below its longer MA. The Composite is growing, having tested its strong support.
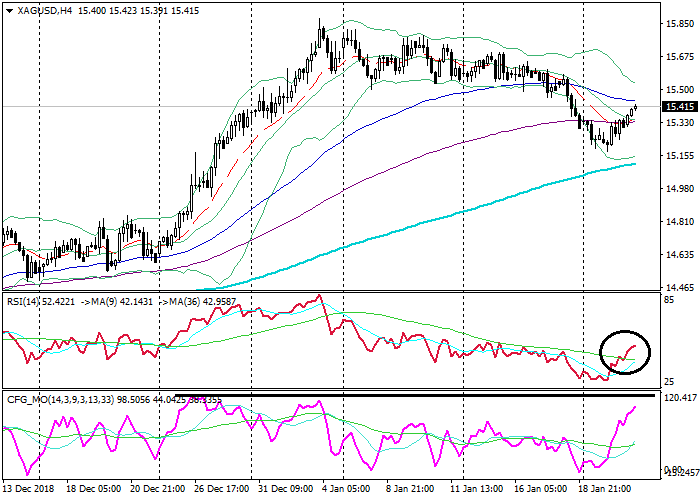
XAG/USD, H4
On the 4-hour chart, the instrument is trading in the upper Bollinger band. The price remains on the level with the EMA65 and above the EMA14, EMA130 and SMA200 that are directed up. The RSI is growing, having broken out its longer MA. The Composite is approaching its strong resistance.
Key levels
Support levels: 15.18 (local lows), 15.00 (local lows), 14.90 (October 2018 highs).
Resistance levels: 15.55 (local highs), 15.80 (local highs), 16.05 (March 2018 lows).
Trading tips
The price is approaching its strong resistance near 15.55. Its breakout would lead to a growth continuation.
Long positions can be opened from the level of 15.55 with targets at 15.80, 16.05 and stop-loss at 15.35. Validity – 3-5 days.
Short positions can be opened from the level of 15.18 with targets at 15.00, 14.90 and stop-loss at 15.30. Validity – 3-5 days.
On the daily chart, the instrument is trading on the middle MA of the Bollinger Bands. The price remains above its moving averages that start turning up. The RSI is about to test from below its longer MA. The Composite is growing, having tested its strong support.
XAG/USD, H4
On the 4-hour chart, the instrument is trading in the upper Bollinger band. The price remains on the level with the EMA65 and above the EMA14, EMA130 and SMA200 that are directed up. The RSI is growing, having broken out its longer MA. The Composite is approaching its strong resistance.
Key levels
Support levels: 15.18 (local lows), 15.00 (local lows), 14.90 (October 2018 highs).
Resistance levels: 15.55 (local highs), 15.80 (local highs), 16.05 (March 2018 lows).
Trading tips
The price is approaching its strong resistance near 15.55. Its breakout would lead to a growth continuation.
Long positions can be opened from the level of 15.55 with targets at 15.80, 16.05 and stop-loss at 15.35. Validity – 3-5 days.
Short positions can be opened from the level of 15.18 with targets at 15.00, 14.90 and stop-loss at 15.30. Validity – 3-5 days.


No comments:
Write comments