
WTI Crude Oil: oil prices are going up
22 January 2019, 09:02
| Scenario | |
|---|---|
| Timeframe | Intraday |
| Recommendation | BUY STOP |
| Entry Point | 54.50 |
| Take Profit | 57.00 |
| Stop Loss | 53.19, 53.00 |
| Key Levels | 49.00, 50.00, 50.92, 52.21, 53.19, 54.43, 55.64, 57.00 |
| Alternative scenario | |
|---|---|
| Recommendation | SELL STOP |
| Entry Point | 52.15 |
| Take Profit | 50.00, 49.00 |
| Stop Loss | 53.19, 53.30 |
| Key Levels | 49.00, 50.00, 50.92, 52.21, 53.19, 54.43, 55.64, 57.00 |
Current trend
WTI crude oil prices showed a weak positive trend on Monday, updating local highs of December 5, 2018.
The strengthening was due to a significant reduction in active oil rigs number in the United States. According to Baker Hughes, the number has decreased from 873 to 852 units. On the other hand, prices are under pressure from the resumption of Iranian oil exports to Japan, interrupted last November due to the introduction of US sanctions.
More confident growth of the instrument was hampered by modest statistics from China, which, although it met the market expectations, still pointed to the continuing slowdown in the growth of the Chinese economy. In addition, traders continue to monitor the development of the trade conflict between the United States and China.
Support and resistance
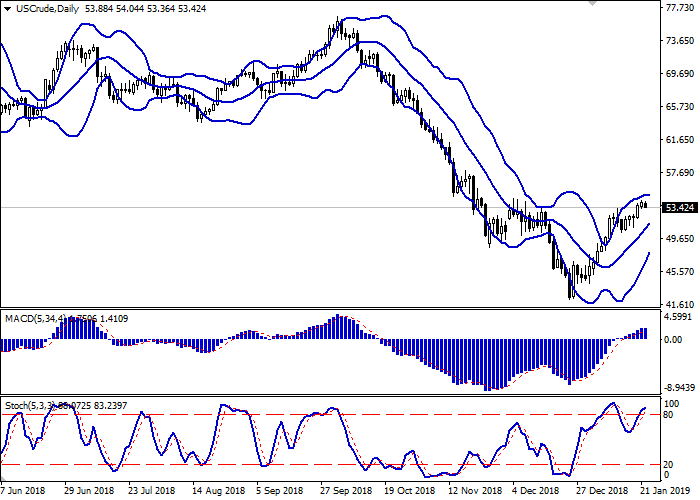
Bollinger Bands in D1 chart show stable growth. The price range is narrowing, reflecting ambiguous dynamics of trading in the short term. MACD is growing, keeping a weak buy signal (located above the signal line). Stochastic retains an upward direction, but is located in close proximity to its maximum values, which indicates instrument is overbought in the short and/or ultra-short term.
It is necessary to keep existing long positions until the situation is clear and updated signals from technical indicators appear.
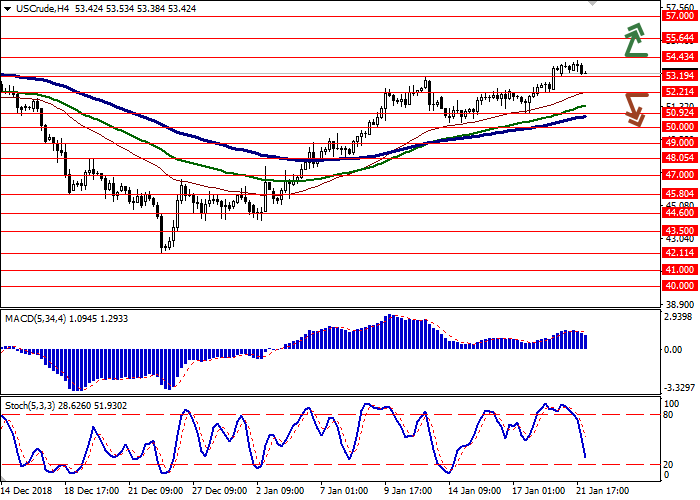
Resistance levels: 54.43, 55.64, 57.00.
Support levels: 53.19, 52.21, 50.92, 50.00, 49.00.
Trading tips
To open long positions, one can rely on the breakout of 54.43. Take profit — 57.00. Stop loss — 53.19 or 53.00. Implementation time: 2 days.
The return of "bearish" trend with the breakdown of 52.21 may become a signal for new sales with the target at 50.00 or 49.00. Stop loss — 53.19 or 53.30. Implementation time: 2-3 days.
WTI crude oil prices showed a weak positive trend on Monday, updating local highs of December 5, 2018.
The strengthening was due to a significant reduction in active oil rigs number in the United States. According to Baker Hughes, the number has decreased from 873 to 852 units. On the other hand, prices are under pressure from the resumption of Iranian oil exports to Japan, interrupted last November due to the introduction of US sanctions.
More confident growth of the instrument was hampered by modest statistics from China, which, although it met the market expectations, still pointed to the continuing slowdown in the growth of the Chinese economy. In addition, traders continue to monitor the development of the trade conflict between the United States and China.
Support and resistance
Bollinger Bands in D1 chart show stable growth. The price range is narrowing, reflecting ambiguous dynamics of trading in the short term. MACD is growing, keeping a weak buy signal (located above the signal line). Stochastic retains an upward direction, but is located in close proximity to its maximum values, which indicates instrument is overbought in the short and/or ultra-short term.
It is necessary to keep existing long positions until the situation is clear and updated signals from technical indicators appear.
Resistance levels: 54.43, 55.64, 57.00.
Support levels: 53.19, 52.21, 50.92, 50.00, 49.00.
Trading tips
To open long positions, one can rely on the breakout of 54.43. Take profit — 57.00. Stop loss — 53.19 or 53.00. Implementation time: 2 days.
The return of "bearish" trend with the breakdown of 52.21 may become a signal for new sales with the target at 50.00 or 49.00. Stop loss — 53.19 or 53.30. Implementation time: 2-3 days.


No comments:
Write comments