
USD/JPY: the instrument is consolidating
28 January 2019, 08:38
| Scenario | |
|---|---|
| Timeframe | Intraday |
| Recommendation | BUY STOP |
| Entry Point | 109.50 |
| Take Profit | 111.00 |
| Stop Loss | 108.90 |
| Key Levels | 107.47, 108.00, 108.58, 109.07, 109.45, 110.00, 110.45, 111.00 |
| Alternative scenario | |
|---|---|
| Recommendation | SELL STOP |
| Entry Point | 109.00 |
| Take Profit | 108.00 |
| Stop Loss | 109.50, 109.60 |
| Key Levels | 107.47, 108.00, 108.58, 109.07, 109.45, 110.00, 110.45, 111.00 |
Current trend
USD is falling against JPY after updating local highs at the end of the last trading week.
JPY was moderately supported by rather strong data on consumer inflation in Tokyo Metropolitan area. Core CPI rose by 1.1% YoY in January, with the forecast of 0.9%. Tokyo CPI accelerated from 0.3% YoY to 0.4%.
In addition, investors continue to monitor the US-China trade conflict. US Commerce Secretary, Wilbur Ross, said in a recent interview that China and the United States are far from the deal, which is understandable judging from the large number of problems that have accumulated in relations between the two countries. Ross did not deny the possibility of extending the truce after March 1.
Support and resistance
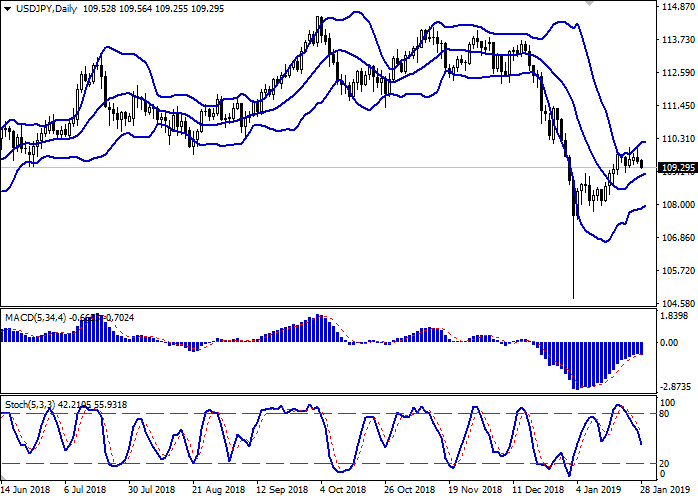
Bollinger Bands in D1 chart show moderate growth. The price range is slightly narrowing from above, reflecting the flat nature of trading in the short term. MACD indicator is reversing downwards and is about to form a sell signal (the histogram has to consolidate below the signal line). Stochastic is going down and is located in the middle of its area.
Technical indicators do not contradict the further development of the correctional downtrend in the short and/or ultra-short term.
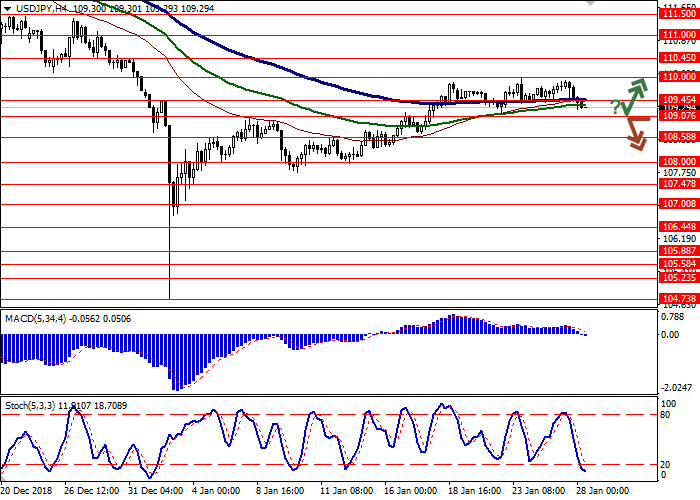
Resistance levels: 109.45, 110.00, 110.45, 111.00.
Support levels: 109.07, 108.58, 108.00, 107.47.
Trading tips
To open long positions, one can rely on the rebound from 109.07 as from support with the subsequent breakout of 109.45. Take profit – 111.00. Stop loss – 108.90. Implementation period: 2-3 days.
The breakdown of 109.07 may serve as a signal to further sales with the target at 108.00. Stop loss — 109.50 or 109.60. Implementation period: 1-2 days.
USD is falling against JPY after updating local highs at the end of the last trading week.
JPY was moderately supported by rather strong data on consumer inflation in Tokyo Metropolitan area. Core CPI rose by 1.1% YoY in January, with the forecast of 0.9%. Tokyo CPI accelerated from 0.3% YoY to 0.4%.
In addition, investors continue to monitor the US-China trade conflict. US Commerce Secretary, Wilbur Ross, said in a recent interview that China and the United States are far from the deal, which is understandable judging from the large number of problems that have accumulated in relations between the two countries. Ross did not deny the possibility of extending the truce after March 1.
Support and resistance
Bollinger Bands in D1 chart show moderate growth. The price range is slightly narrowing from above, reflecting the flat nature of trading in the short term. MACD indicator is reversing downwards and is about to form a sell signal (the histogram has to consolidate below the signal line). Stochastic is going down and is located in the middle of its area.
Technical indicators do not contradict the further development of the correctional downtrend in the short and/or ultra-short term.
Resistance levels: 109.45, 110.00, 110.45, 111.00.
Support levels: 109.07, 108.58, 108.00, 107.47.
Trading tips
To open long positions, one can rely on the rebound from 109.07 as from support with the subsequent breakout of 109.45. Take profit – 111.00. Stop loss – 108.90. Implementation period: 2-3 days.
The breakdown of 109.07 may serve as a signal to further sales with the target at 108.00. Stop loss — 109.50 or 109.60. Implementation period: 1-2 days.


No comments:
Write comments