
USD/JPY: the dollar is consolidating
23 January 2019, 08:33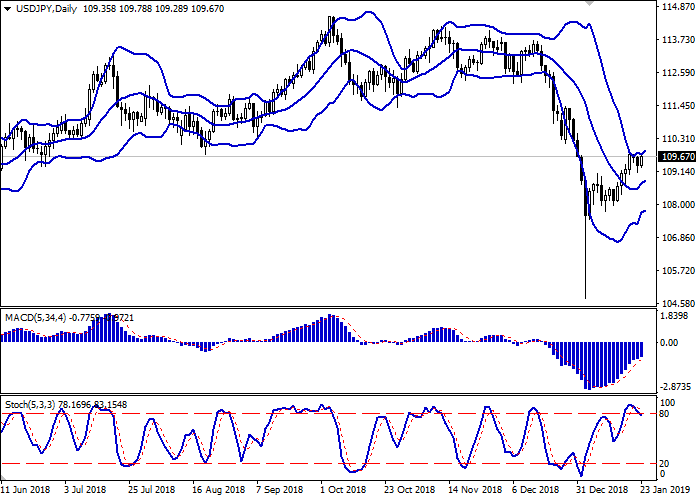
| Scenario | |
|---|---|
| Timeframe | Intraday |
| Recommendation | BUY STOP |
| Entry Point | 110.05 |
| Take Profit | 111.0, 111.50 |
| Stop Loss | 109.45, 109.30 |
| Key Levels | 108.00, 108.58, 109.07, 109.45, 110.00, 110.45, 111.00, 111.50 |
| Alternative scenario | |
|---|---|
| Recommendation | SELL STOP |
| Entry Point | 109.00 |
| Take Profit | 108.00 |
| Stop Loss | 109.50, 109.60 |
| Key Levels | 108.00, 108.58, 109.07, 109.45, 110.00, 110.45, 111.00, 111.50 |
Current trend
USD shows ambiguous dynamics against JPY, consolidating near local highs, updated on January 18.
Today, the pair is trading higher, as JPY remains under pressure against the background of publication of macroeconomic statistics from Japan and the Bank of Japan meeting on interest rates.
Japanese exports went down by 3.8% YoY in December after growth by 0.1% in the previous month. Analysts had expected negative dynamics, but they hoped for a decline only by 1.9% YoY. Imports growth in December slowed down significantly from 12.5% YoY to 1.9% with 3.7% YoY expected. Trade balance deficiency amounted to JPY 55B with the forecast of 29.5B.
The Bank of Japan expectedly kept the interest rate unchanged at –0.10%. At the same time, the regulator revised its forecasts in their report. The BoJ expects the growth rate of inflation in the range from 1.0% to 1.3% YoY in 2019, while in October 2018 the expected growth was from 1.5% to 1.7% YoY.
Support and resistance
Bollinger Bands in D1 chart show moderate growth. The price range expands, freeing a path to new local highs for the "bulls". MACD indicator is growing, keeping a stable buy signal (located above the signal line). Stochastic is falling, retreating from its highs. As before, the indicator points at the overbought USD in the ultra-short term.
It is necessary to wait for emergence of specifying signals from technical indicators.
Resistance levels: 110.00, 110.45, 111.00, 111.50.
Support levels: 109.45, 109.07, 108.58, 108.00.

Trading tips
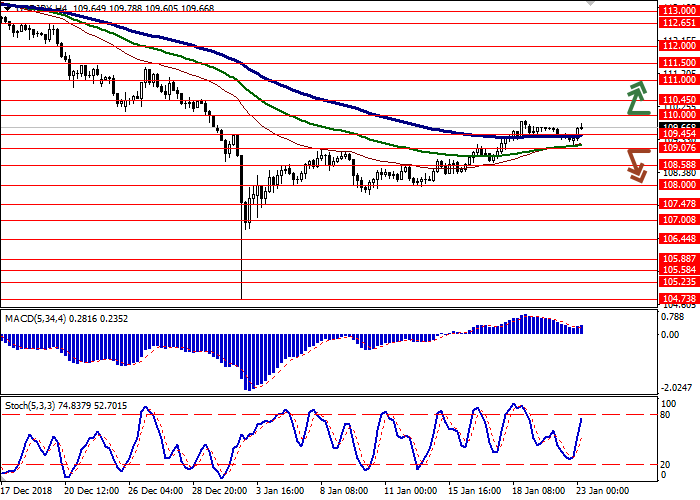
To open long positions, one can rely on the breakout of 110.00. Take profit — 111.00 or 111.50. Stop loss — 109.45 or 109.30.
The breakdown of 109.07 may serve as a signal for new sales with the target at 108.00. Stop loss — 109.50 or 109.60.
Implementation period: 2-3 days.
USD shows ambiguous dynamics against JPY, consolidating near local highs, updated on January 18.
Today, the pair is trading higher, as JPY remains under pressure against the background of publication of macroeconomic statistics from Japan and the Bank of Japan meeting on interest rates.
Japanese exports went down by 3.8% YoY in December after growth by 0.1% in the previous month. Analysts had expected negative dynamics, but they hoped for a decline only by 1.9% YoY. Imports growth in December slowed down significantly from 12.5% YoY to 1.9% with 3.7% YoY expected. Trade balance deficiency amounted to JPY 55B with the forecast of 29.5B.
The Bank of Japan expectedly kept the interest rate unchanged at –0.10%. At the same time, the regulator revised its forecasts in their report. The BoJ expects the growth rate of inflation in the range from 1.0% to 1.3% YoY in 2019, while in October 2018 the expected growth was from 1.5% to 1.7% YoY.
Support and resistance
Bollinger Bands in D1 chart show moderate growth. The price range expands, freeing a path to new local highs for the "bulls". MACD indicator is growing, keeping a stable buy signal (located above the signal line). Stochastic is falling, retreating from its highs. As before, the indicator points at the overbought USD in the ultra-short term.
It is necessary to wait for emergence of specifying signals from technical indicators.
Resistance levels: 110.00, 110.45, 111.00, 111.50.
Support levels: 109.45, 109.07, 108.58, 108.00.
Trading tips
To open long positions, one can rely on the breakout of 110.00. Take profit — 111.00 or 111.50. Stop loss — 109.45 or 109.30.
The breakdown of 109.07 may serve as a signal for new sales with the target at 108.00. Stop loss — 109.50 or 109.60.
Implementation period: 2-3 days.


No comments:
Write comments