
USD/CHF: dollar under pressure
29 January 2019, 09:08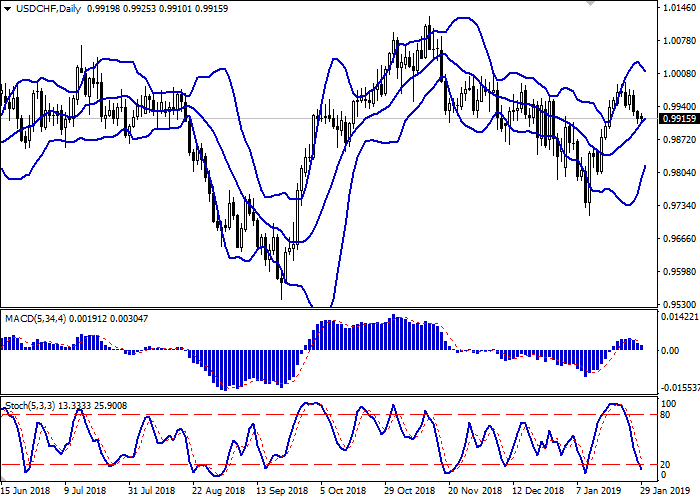
| Scenario | |
|---|---|
| Timeframe | Intraday |
| Recommendation | BUY STOP |
| Entry Point | 0.9940 |
| Take Profit | 0.9980, 1.0000 |
| Stop Loss | 0.9910 |
| Key Levels | 0.9800, 0.9847, 0.9871, 0.9900, 0.9936, 0.9962, 0.9980, 1.0000 |
| Alternative scenario | |
|---|---|
| Recommendation | SELL STOP |
| Entry Point | 0.9895 |
| Take Profit | 0.9847 |
| Stop Loss | 0.9920, 0.9930 |
| Key Levels | 0.9800, 0.9847, 0.9871, 0.9900, 0.9936, 0.9962, 0.9980, 1.0000 |
Current trend
Yesterday, USD fell against CHF, renewing the lows since January 17.
Investors are focused on the Shutdown. On Friday, President Donald Trump financed the government for three weeks. However, the opposition of the presidential administration and the Democratic Party is not over. In a Sunday interview with The Wall Street Journal, Trump stated that the new government closure on February 15 is “certainly an option” and believed that the Congress would approve full funding of the border wall of $5.7 billion, since he may not agree on partial funding.
This week, American investors expect the Fed’s meeting and the visit of the Chinese delegation led by Vice-Premier of the State Council of China Liu He. The regulator may change the number of rate increases this year. At the December Fed’s Fed, there were planned two increases but since then, many members of the regulator have expressed the need to postpone the tightening of monetary policy.
Support and resistance
On the daily chart, Bollinger bands grew moderately. The price range actively narrows, reflecting the emergence of ambiguous dynamics in the medium/short term. MACD falls, keeping a poor sell signal (the histogram is below the signal line). Stochastic decreases but is rapidly approaching its lows, indicating that USD can become oversold in the super-short term.
The current readings of the indicators do not contradict the further development of the “bearish” trend.
Resistance levels: 0.9936, 0.9962, 0.9980, 1.0000.
Support levels: 0.9900, 0.9871, 0.9847, 0.9800.
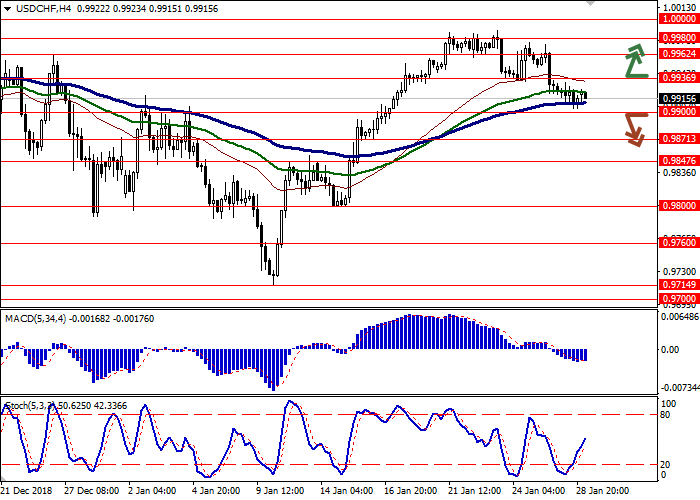

Trading tips
Long positions can be opened after the breakout of 0.9936 with the target at 0.9980 or 1.0000. Stop loss is 0.9910. Implementation period: 2–3 days.
Short positions can be opened after the breakdown of 0.9900 with the target at 0.9847. Stop loss is 0.9920–0.9930. Implementation period: 1–2 days.
Yesterday, USD fell against CHF, renewing the lows since January 17.
Investors are focused on the Shutdown. On Friday, President Donald Trump financed the government for three weeks. However, the opposition of the presidential administration and the Democratic Party is not over. In a Sunday interview with The Wall Street Journal, Trump stated that the new government closure on February 15 is “certainly an option” and believed that the Congress would approve full funding of the border wall of $5.7 billion, since he may not agree on partial funding.
This week, American investors expect the Fed’s meeting and the visit of the Chinese delegation led by Vice-Premier of the State Council of China Liu He. The regulator may change the number of rate increases this year. At the December Fed’s Fed, there were planned two increases but since then, many members of the regulator have expressed the need to postpone the tightening of monetary policy.
Support and resistance
On the daily chart, Bollinger bands grew moderately. The price range actively narrows, reflecting the emergence of ambiguous dynamics in the medium/short term. MACD falls, keeping a poor sell signal (the histogram is below the signal line). Stochastic decreases but is rapidly approaching its lows, indicating that USD can become oversold in the super-short term.
The current readings of the indicators do not contradict the further development of the “bearish” trend.
Resistance levels: 0.9936, 0.9962, 0.9980, 1.0000.
Support levels: 0.9900, 0.9871, 0.9847, 0.9800.
Trading tips
Long positions can be opened after the breakout of 0.9936 with the target at 0.9980 or 1.0000. Stop loss is 0.9910. Implementation period: 2–3 days.
Short positions can be opened after the breakdown of 0.9900 with the target at 0.9847. Stop loss is 0.9920–0.9930. Implementation period: 1–2 days.


No comments:
Write comments