
USD/CHF: dollar strengthens
21 January 2019, 09:15
| Scenario | |
|---|---|
| Timeframe | Intraday |
| Recommendation | BUY STOP |
| Entry Point | 0.9970 |
| Take Profit | 1.0000, 1.0020 |
| Stop Loss | 0.9940, 0.9936 |
| Key Levels | 0.9871, 0.9900, 0.9919, 0.9936, 0.9962, 0.9980, 1.0000 |
| Alternative scenario | |
|---|---|
| Recommendation | SELL STOP |
| Entry Point | 0.9930 |
| Take Profit | 0.9900, 0.9871 |
| Stop Loss | 0.9962 |
| Key Levels | 0.9871, 0.9900, 0.9919, 0.9936, 0.9962, 0.9980, 1.0000 |
Current trend
USD is growing moderately against CHF, renewing the highs since December 26, 2018. Published on Friday, macroeconomic data from Switzerland and the Eurozone could not support CHF. Thus, the Producer Price Index and Swiss imports fell by 0.6% MoM in December after falling by 0.3% MoM last month and slowed down from +1.4% YoY to +0.6% YoY.
However, American statistics also failed to encourage investors. Industrial Production in December rose by 0.3% MoM after rising by 0.4% MoM last month. Analysts had expected a slowdown to +0.2% MoM. At the same time, the Capacity Utilization increased from 78.6% to 78.7%, contrary to forecasts of a decline to 78.5%. In January, The University of Michigan Consumer Confidence Index fell sharply from 98.3 to 90.7 points, with expectations of 97.0 points.
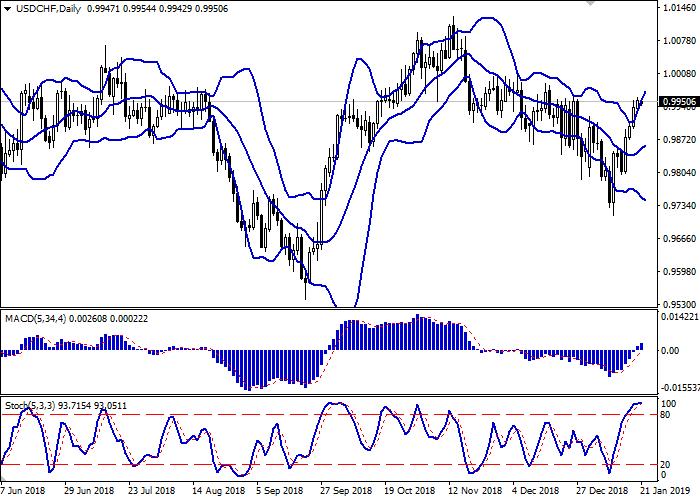
Support and resistance
On the daily chart, Bollinger bands are growing moderately. The price range is expanding, letting the “bulls” renew local highs. MACD indicator is growing, keeping a strong buy signal (the histogram is above the signal line). Stochastic, reaching its high, reversed horizontally, indicating the risks associated with the overbought dollar in the short and/or super short term.
It is better to keep current long positions until the clarification of trading signals.
Resistance levels: 0.9962, 0.9980, 1.0000.
Support levels: 0.9936, 0.9919, 0.9900, 0.9871.
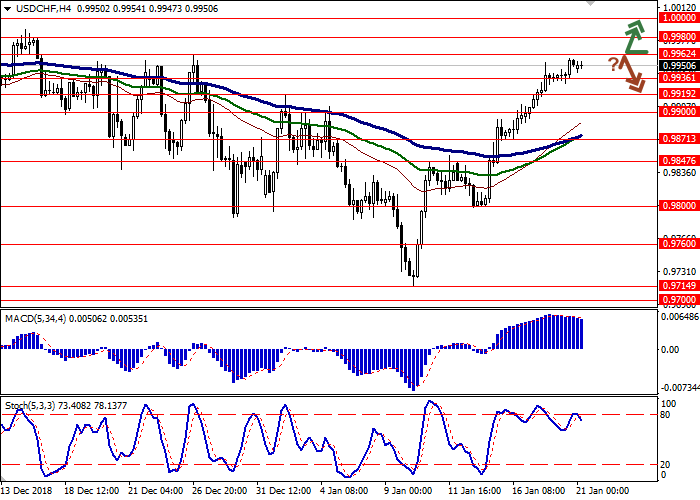
Trading tips
Long positions can be opened after the breakout of the level of 0.9962 with the target at 1.0000 or 1.0020. Stop loss is 0.9940–0.9936.
Short positions can be opened after a rebound from the level of 0.9962 and the breakdown of the level of 0.9936 with the target of 0.9900 or 0.9871. Stop loss is 0.9962.
Implementation period: 2–3 days.
USD is growing moderately against CHF, renewing the highs since December 26, 2018. Published on Friday, macroeconomic data from Switzerland and the Eurozone could not support CHF. Thus, the Producer Price Index and Swiss imports fell by 0.6% MoM in December after falling by 0.3% MoM last month and slowed down from +1.4% YoY to +0.6% YoY.
However, American statistics also failed to encourage investors. Industrial Production in December rose by 0.3% MoM after rising by 0.4% MoM last month. Analysts had expected a slowdown to +0.2% MoM. At the same time, the Capacity Utilization increased from 78.6% to 78.7%, contrary to forecasts of a decline to 78.5%. In January, The University of Michigan Consumer Confidence Index fell sharply from 98.3 to 90.7 points, with expectations of 97.0 points.
Support and resistance
On the daily chart, Bollinger bands are growing moderately. The price range is expanding, letting the “bulls” renew local highs. MACD indicator is growing, keeping a strong buy signal (the histogram is above the signal line). Stochastic, reaching its high, reversed horizontally, indicating the risks associated with the overbought dollar in the short and/or super short term.
It is better to keep current long positions until the clarification of trading signals.
Resistance levels: 0.9962, 0.9980, 1.0000.
Support levels: 0.9936, 0.9919, 0.9900, 0.9871.
Trading tips
Long positions can be opened after the breakout of the level of 0.9962 with the target at 1.0000 or 1.0020. Stop loss is 0.9940–0.9936.
Short positions can be opened after a rebound from the level of 0.9962 and the breakdown of the level of 0.9936 with the target of 0.9900 or 0.9871. Stop loss is 0.9962.
Implementation period: 2–3 days.


No comments:
Write comments