
NZD/USD: New Zealand dollar strengthens
23 January 2019, 09:40
| Scenario | |
|---|---|
| Timeframe | Intraday |
| Recommendation | BUY STOP |
| Entry Point | 0.6795 |
| Take Profit | 0.6830, 0.6847 |
| Stop Loss | 0.6770, 0.6760 |
| Key Levels | 0.6704, 0.6730, 0.6754, 0.6770, 0.6789, 0.6807, 0.6847, 0.6878 |
| Alternative scenario | |
|---|---|
| Recommendation | SELL STOP |
| Entry Point | 0.6765 |
| Take Profit | 0.6730, 0.6704 |
| Stop Loss | 0.6789 |
| Key Levels | 0.6704, 0.6730, 0.6754, 0.6770, 0.6789, 0.6807, 0.6847, 0.6878 |
Current trend
NZD showed moderate growth against USD on Tuesday, departing from the updated local lows of January 4.
The active growth of the instrument is traced today against the background of the publication of statistics on consumer inflation in New Zealand for Q4 2018. Consumer Price Index showed an increase of 0.1% QoQ and 1.9% YoY, which was slightly better than market expectations of 0.0% QoQ and +1.8% YoY.
USD, in turn, remains under pressure from data on Existing Home Sales. In December, the index went down sharply by 6.4% MoM after growing by 2.1% MoM a month earlier. Experts expected a decrease of 1.0% MoM. In absolute terms, sales fell from 5.33M homes to 4.99M, with a forecast of 5.25M.
Support and resistance
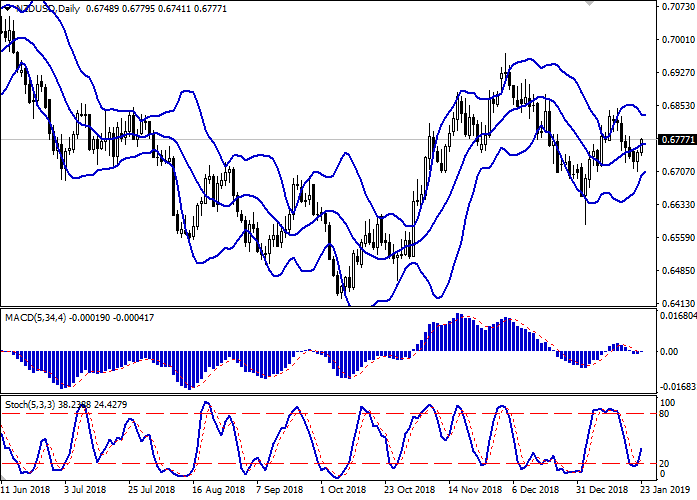
Bollinger Bands in D1 chart show unsteady growth. The price range is narrowing, reflecting ambiguous nature of trading in the short term. MACD has reversed to growth having formed a weak buy signal (located above the signal line). The indicator is also trying to consolidate above the zero level. Stochastic shows similar dynamics after reversal upwards at the level "20".
The development of corrective decline of NZD is possible in the short and/or ultra-short term.
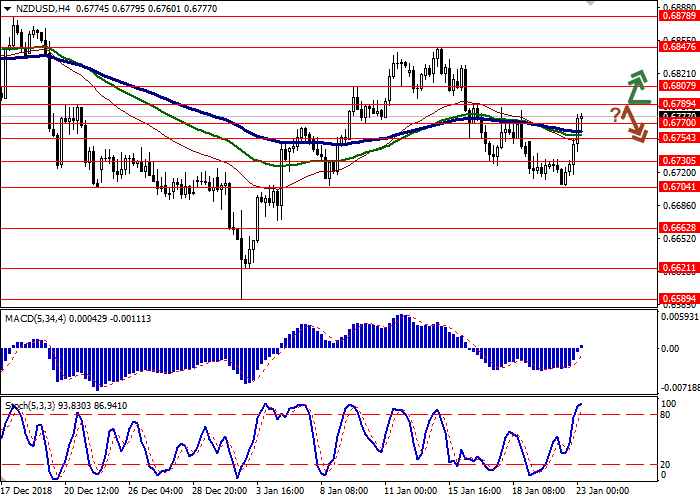
Resistance levels: 0.6789, 0.6807, 0.6847, 0.6878.
Support levels: 0.6770, 0.6754, 0.6730, 0.6704.
Trading tips
To open long positions, one can rely on the breakout of 0.6789. Take profit — 0.6830 or 0.6847. Stop loss — 0.6770 or 0.6760.
The rebound from the level of 0.6789 as from resistance with the subsequent breakdown of 0.6770 can become a signal to begin correctional sales with target at 0.6730 or 0.6704. Stop loss — 0.6789.
Implementation period: 2-3 days.
NZD showed moderate growth against USD on Tuesday, departing from the updated local lows of January 4.
The active growth of the instrument is traced today against the background of the publication of statistics on consumer inflation in New Zealand for Q4 2018. Consumer Price Index showed an increase of 0.1% QoQ and 1.9% YoY, which was slightly better than market expectations of 0.0% QoQ and +1.8% YoY.
USD, in turn, remains under pressure from data on Existing Home Sales. In December, the index went down sharply by 6.4% MoM after growing by 2.1% MoM a month earlier. Experts expected a decrease of 1.0% MoM. In absolute terms, sales fell from 5.33M homes to 4.99M, with a forecast of 5.25M.
Support and resistance
Bollinger Bands in D1 chart show unsteady growth. The price range is narrowing, reflecting ambiguous nature of trading in the short term. MACD has reversed to growth having formed a weak buy signal (located above the signal line). The indicator is also trying to consolidate above the zero level. Stochastic shows similar dynamics after reversal upwards at the level "20".
The development of corrective decline of NZD is possible in the short and/or ultra-short term.
Resistance levels: 0.6789, 0.6807, 0.6847, 0.6878.
Support levels: 0.6770, 0.6754, 0.6730, 0.6704.
Trading tips
To open long positions, one can rely on the breakout of 0.6789. Take profit — 0.6830 or 0.6847. Stop loss — 0.6770 or 0.6760.
The rebound from the level of 0.6789 as from resistance with the subsequent breakdown of 0.6770 can become a signal to begin correctional sales with target at 0.6730 or 0.6704. Stop loss — 0.6789.
Implementation period: 2-3 days.


No comments:
Write comments