GBP/USD: general review
18 January 2019, 11:32
| Scenario | |
|---|---|
| Timeframe | Intraday |
| Recommendation | BUY STOP |
| Entry Point | 1.3000 |
| Take Profit | 1.3069 |
| Stop Loss | 1.2970 |
| Key Levels | 1.2391, 1.2536, 1.2591, 1.2649, 1.2667, 1.2709, 1.2772, 1.2831, 1.2865, 1.2931, 1.3000, 1.3030, 1.3069, 1.3173, 1.3235 |
| Alternative scenario | |
|---|---|
| Recommendation | SELL STOP |
| Entry Point | 1.2865 |
| Take Profit | 1.2775 |
| Stop Loss | 1.2930 |
| Key Levels | 1.2391, 1.2536, 1.2591, 1.2649, 1.2667, 1.2709, 1.2772, 1.2831, 1.2865, 1.2931, 1.3000, 1.3030, 1.3069, 1.3173, 1.3235 |
Current trend
GBP strengthened against the US dollar on Thursday against the news of Teresa May, who survived a vote of no confidence and is preparing an alternative Brexit deal by Monday.
Data on the US labor market were contradictory: USD was supported by the decline in Initial Jobless Claims to 213K, which was 3K less than the previous figure and 7K less than the forecast. At the same time, Continuing Jobless Claims were 1.737M, which turned out to be higher than the forecast, putting pressure on USD. Philadelphia Fed Manufacturing Index was better than expected reaching 17.0 points in January against 9.1 points a month earlier.
Macroeconomic releases able to influence the instrument today include data on retail sales in the UK (11:30 GMT+2). The indicator MoM is expected to decrease to –0.8% in December from 1.4% a month earlier, and YoY it can remain unchanged at 3.6%. Data on Industrial Production will be published in the US today (16:15 GMT+2). It is expected that the indicator will fall to 0.2% in December from 0.6% a month earlier. If the forecast proves right, it could put pressure on USD in the short term.
Support and resistance
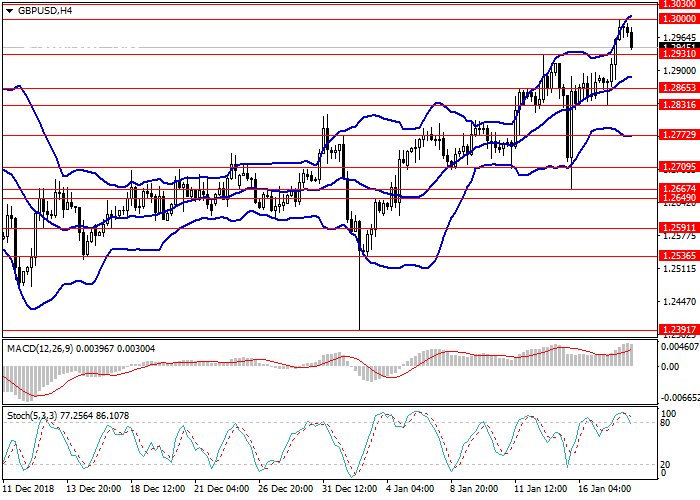
On the H4 chart, a downward movement correction is observed, the pair is trading between the upper and lower borders of Bollinger Bands; the price range expanded. MACD histogram is in the positive area keeping a signal for the opening of long positions.
Resistance levels: 1.3000, 1.3030, 1.3069, 1.3173, 1.3235.
Support levels: 1.2931, 1.2865, 1.2831, 1.2772, 1.2709, 1.2667, 1.2649, 1.2591, 1.2536, 1.2391.

Trading tips
Long positions may be opened from 1.3000 with target at 1.3069 and stop loss at 1.2970.
Short positions may be opened from 1.2865 with target at 1.2775 and stop loss at 1.2930.
Implementation time: 1-3 days.
GBP strengthened against the US dollar on Thursday against the news of Teresa May, who survived a vote of no confidence and is preparing an alternative Brexit deal by Monday.
Data on the US labor market were contradictory: USD was supported by the decline in Initial Jobless Claims to 213K, which was 3K less than the previous figure and 7K less than the forecast. At the same time, Continuing Jobless Claims were 1.737M, which turned out to be higher than the forecast, putting pressure on USD. Philadelphia Fed Manufacturing Index was better than expected reaching 17.0 points in January against 9.1 points a month earlier.
Macroeconomic releases able to influence the instrument today include data on retail sales in the UK (11:30 GMT+2). The indicator MoM is expected to decrease to –0.8% in December from 1.4% a month earlier, and YoY it can remain unchanged at 3.6%. Data on Industrial Production will be published in the US today (16:15 GMT+2). It is expected that the indicator will fall to 0.2% in December from 0.6% a month earlier. If the forecast proves right, it could put pressure on USD in the short term.
Support and resistance
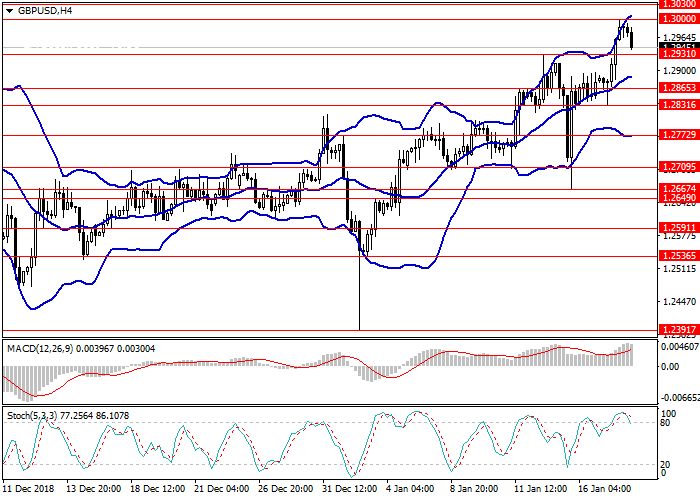
On the H4 chart, a downward movement correction is observed, the pair is trading between the upper and lower borders of Bollinger Bands; the price range expanded. MACD histogram is in the positive area keeping a signal for the opening of long positions.
Resistance levels: 1.3000, 1.3030, 1.3069, 1.3173, 1.3235.
Support levels: 1.2931, 1.2865, 1.2831, 1.2772, 1.2709, 1.2667, 1.2649, 1.2591, 1.2536, 1.2391.

Trading tips
Long positions may be opened from 1.3000 with target at 1.3069 and stop loss at 1.2970.
Short positions may be opened from 1.2865 with target at 1.2775 and stop loss at 1.2930.
Implementation time: 1-3 days.


No comments:
Write comments