
Ethereum: technical analysis
10 January 2019, 11:15
| Scenario | |
|---|---|
| Timeframe | Weekly |
| Recommendation | SELL |
| Entry Point | 132.60 |
| Take Profit | 125.00, 112.50 |
| Stop Loss | 145.00 |
| Key Levels | 100.00, 112.50, 125.00, 137.50, 150.00, 162.50, 175.00 |
| Alternative scenario | |
|---|---|
| Recommendation | BUY STOP |
| Entry Point | 155.00 |
| Take Profit | 162.50, 175.00 |
| Stop Loss | 140.00 |
| Key Levels | 100.00, 112.50, 125.00, 137.50, 150.00, 162.50, 175.00 |
Current trend
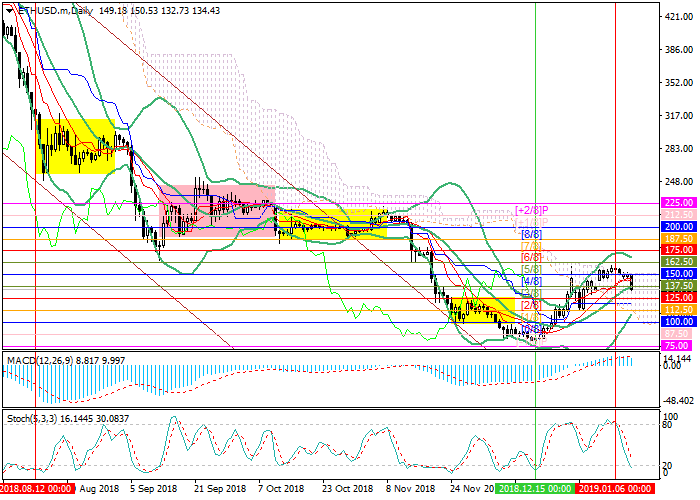
This week, the price of Ether is being corrected downwards after 4-week growth. At the moment, the rate has fallen to the middle line of Bollinger bands. After the consolidation below it, the instrument will be able to decline to 125.00 (Murrey [2/8]), 112.50 (Murrey [1/8]) and 100.00 (Murrey [0/8]). In general, technical indicators confirm the forecast. MACD histogram is decreasing in the positive zone, Stochastic is directed downwards.
The resumption of the upward movement will be possible after the price consolidates above the level of 150.00 (Murrey [4/8]) and enters the upper zone of the Murrey trading range. In this case, the “bullish” targets will be the levels of 162.50 (Murrey [5/8]) and 175.00 (Murrey [6/8]).
Support and resistance
Resistance levels: 150.00, 162.50, 175.00.
Support levels: 137.50, 125.00, 112.50, 100.00.
Trading tips
Short positions can be opened from the current level with the targets at 125.00, 112.50 and stop loss around 145.00.
Long positions can be opened after the price is fixed above the level of 150.00 with the targets at 162.50 and 175.00. Stop loss is around 140.00.
Implementation period: 3–5 days.


No comments:
Write comments