
CAC: technical analysis
22 January 2019, 10:30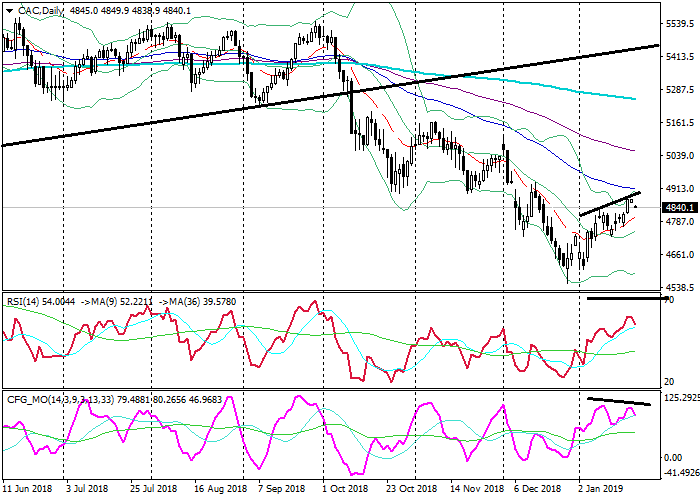
| Scenario | |
|---|---|
| Timeframe | Weekly |
| Recommendation | SELL |
| Entry Point | 4848.9 |
| Take Profit | 4780.0, 4730.0, 4650.0 |
| Stop Loss | 4890.0 |
| Key Levels | 4650.0, 4730.0, 4780.0, 4890.0, 4930.0, 5035.0 |
| Alternative scenario | |
|---|---|
| Recommendation | BUY STOP |
| Entry Point | 4930.0 |
| Take Profit | 5035.0 |
| Stop Loss | 4890.0 |
| Key Levels | 4650.0, 4730.0, 4780.0, 4890.0, 4930.0, 5035.0 |
CAC, D1
On the daily chart, the instrument is trading in the upper Bollinger band. The price remains below the EMA65, EMA130 and SMA200 that are directed down. The RSI is approaching the border of the overbought zone. The Composite is forming a Bearish divergence with the price.

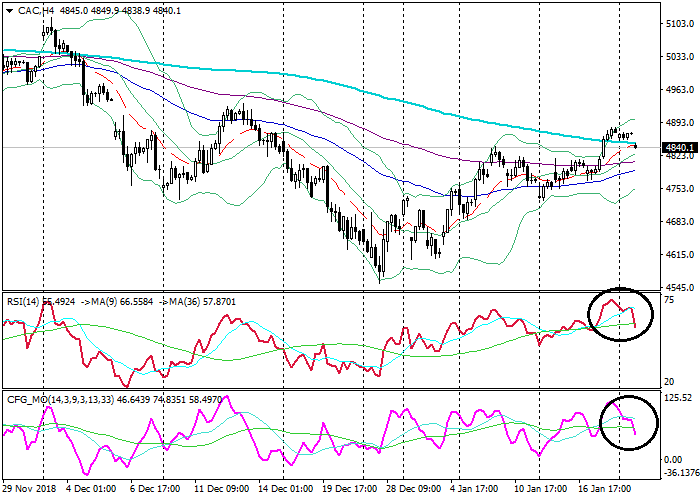
CAC, H4
On the 4-hour chart, the instrument is trading in the upper Bollinger band. The price remains on the level with its moving averages that start turning up. The RSI is testing from above its longer MA. The Composite is falling, having broken down its longer MA.
Key levels
Support levels: 4780.0 (local lows), 4730.0 (local lows), 4650.0 (local lows).
Resistance levels: 4890.0 (November 2018 lows), 4930.0 (local highs), 5035.0 (local highs).
Trading tips
The price has failed its strong resistance near 4890.0. The fall is likely to continue.
Short positions can be opened from current prices with targets at 4780.0, 4730.0, 4650.0 and stop-loss at 4890.0. Validity – 3-5 days.
Long positions can be opened from the level of 4930.0 with the target at 5035.0 and stop-loss at 4890.0. Validity – 3-5 days.
On the daily chart, the instrument is trading in the upper Bollinger band. The price remains below the EMA65, EMA130 and SMA200 that are directed down. The RSI is approaching the border of the overbought zone. The Composite is forming a Bearish divergence with the price.
CAC, H4
On the 4-hour chart, the instrument is trading in the upper Bollinger band. The price remains on the level with its moving averages that start turning up. The RSI is testing from above its longer MA. The Composite is falling, having broken down its longer MA.
Key levels
Support levels: 4780.0 (local lows), 4730.0 (local lows), 4650.0 (local lows).
Resistance levels: 4890.0 (November 2018 lows), 4930.0 (local highs), 5035.0 (local highs).
Trading tips
The price has failed its strong resistance near 4890.0. The fall is likely to continue.
Short positions can be opened from current prices with targets at 4780.0, 4730.0, 4650.0 and stop-loss at 4890.0. Validity – 3-5 days.
Long positions can be opened from the level of 4930.0 with the target at 5035.0 and stop-loss at 4890.0. Validity – 3-5 days.


No comments:
Write comments