
Brent Crude Oil: Murrey Analysis
21 January 2019, 12:00
| Scenario | |
|---|---|
| Timeframe | Weekly |
| Recommendation | BUY STOP |
| Entry Point | 62.55 |
| Take Profit | 65.62 |
| Stop Loss | 61.70 |
| Key Levels | 56.25, 59.37, 62.50, 65.62 |
| Alternative scenario | |
|---|---|
| Recommendation | SELL STOP |
| Entry Point | 61.00 |
| Take Profit | 59.37 |
| Stop Loss | 61.80 |
| Key Levels | 56.25, 59.37, 62.50, 65.62 |
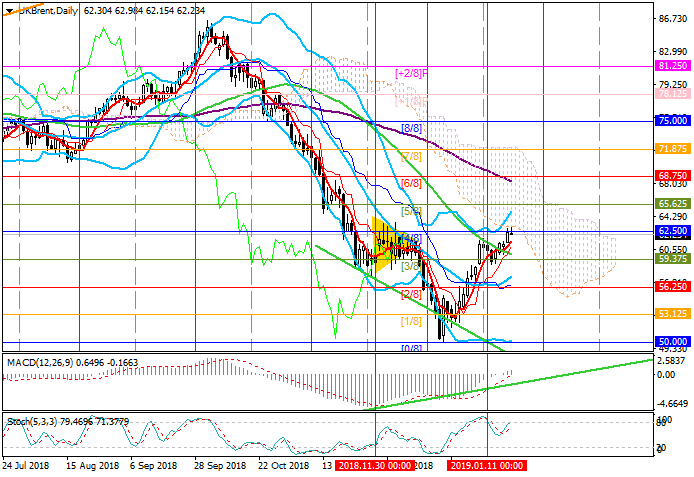
On the daily chart, the pair is testing the central level of the Murrey
trading range around 62.50 ([4/8]). If the price manages to consolidate above
it, the growth will continue to the level of 65.62 [5/8].
Technical indicators confirm the possibility of further growth. Bollinger bands are reversing upwards. MACD histogram increases in the positive zone. Stochastic is directed upwards but it approaches the overbought zone, therefore the potential for an increase in oil prices seems to be limited. If the price cannot break the level of 62.50, a decline to the lower border of the central channel of Murrey, in the area of 59.37 ([3/8]), may begin.
Support and resistance
Resistance levels: 62.50, 65.62.
Support levels: 59.37, 56.25.
Trading tips
Long positions can be opened above the level of 62.50 with the target at 65.62 and stop loss 61.70.
Short positions can be opened from the level of 61.00 with the target at 59.37 and stop loss 61.80.
Implementation period: 4–5 days.


No comments:
Write comments