
Brent Crude Oil: general analysis
29 January 2019, 13:51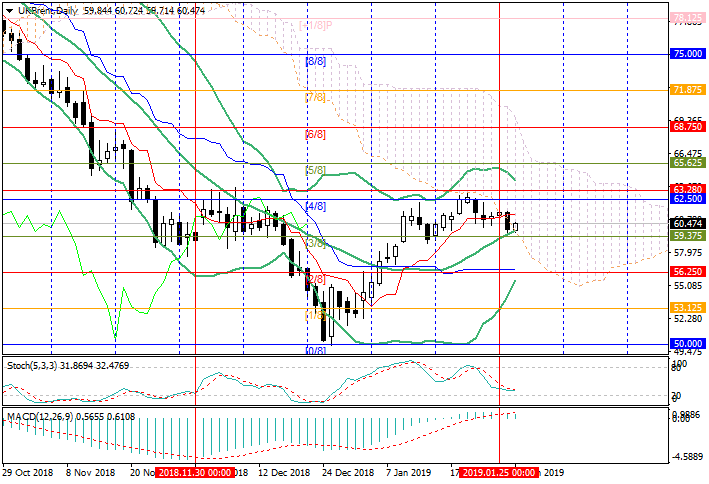
| Scenario | |
|---|---|
| Timeframe | Weekly |
| Recommendation | SELL |
| Entry Point | 59.27 |
| Take Profit | 56.25 |
| Stop Loss | 60.00 |
| Key Levels | 56.25, 59.37, 62.50, 63.28, 65.62 |
| Alternative scenario | |
|---|---|
| Recommendation | BUY STOP |
| Entry Point | 61.05 |
| Take Profit | 62.50, 63.28 |
| Stop Loss | 60.20 |
| Key Levels | 56.25, 59.37, 62.50, 63.28, 65.62 |
Current trend
Today, oil quotes grow due to the introduction of US sanctions against Venezuela state oil and gas company PDVSA, and to the intentions of Saudi Arabia to reduce energy production.
Yesterday, the adviser to the US President John Bolton said that the US authorities imposed sanctions against PDVSA and froze its assets worth $7 billion. However, a subsidiary of PDVSA, Citgo Petroleum, located in the US, can continue the work but its profits will stay in the blocked US accounts. The instrument was also supported by Saudi Arabia Minister, Khalid Al-Falih. He said that next month his country could reduce the oil production, and keep it less the OPEC+ agreement stated for the next six months. According to him, Saudi Arabia can produce 10.33 million barrels per day. In February, it is planned to reduce production to 10.10 million barrels per day.
Today, investors wait for API Crude Oil Stocks release, which grew by 6.550 million barrels in the previous period. The continuation of the trend may halt the price rise.
Support and resistance
The instrument reached the area of 59.37 (Murrey [3/8], the midline of Bollinger bands) and tries to reverse upwards. The growth target can be 62.50 (Murrey [4/8]) and 63.28 (Murrey [+2/8], H4). The key “bearish” level is 59.37. Its breakdown will let the price fall to 56.25 (Murrey [2/8]).
Technical indicators do not give a clear signal. MACD histogram is stable in the positive zone. Stochastic is directed horizontally.
Resistance levels: 62.50, 63.28, 65.62.
Support levels: 59.37, 56.25.

Trading tips
Short positions can be opened below 59.37 with the target at 56.25 and stop loss 60.00.
Long positions can be opened above 61.00 with the targets at 62.50, 63.28 and stop loss around 60.20.
Implementation period: 4–5 days.
Today, oil quotes grow due to the introduction of US sanctions against Venezuela state oil and gas company PDVSA, and to the intentions of Saudi Arabia to reduce energy production.
Yesterday, the adviser to the US President John Bolton said that the US authorities imposed sanctions against PDVSA and froze its assets worth $7 billion. However, a subsidiary of PDVSA, Citgo Petroleum, located in the US, can continue the work but its profits will stay in the blocked US accounts. The instrument was also supported by Saudi Arabia Minister, Khalid Al-Falih. He said that next month his country could reduce the oil production, and keep it less the OPEC+ agreement stated for the next six months. According to him, Saudi Arabia can produce 10.33 million barrels per day. In February, it is planned to reduce production to 10.10 million barrels per day.
Today, investors wait for API Crude Oil Stocks release, which grew by 6.550 million barrels in the previous period. The continuation of the trend may halt the price rise.
Support and resistance
The instrument reached the area of 59.37 (Murrey [3/8], the midline of Bollinger bands) and tries to reverse upwards. The growth target can be 62.50 (Murrey [4/8]) and 63.28 (Murrey [+2/8], H4). The key “bearish” level is 59.37. Its breakdown will let the price fall to 56.25 (Murrey [2/8]).
Technical indicators do not give a clear signal. MACD histogram is stable in the positive zone. Stochastic is directed horizontally.
Resistance levels: 62.50, 63.28, 65.62.
Support levels: 59.37, 56.25.
Trading tips
Short positions can be opened below 59.37 with the target at 56.25 and stop loss 60.00.
Long positions can be opened above 61.00 with the targets at 62.50, 63.28 and stop loss around 60.20.
Implementation period: 4–5 days.


No comments:
Write comments