
Bitcoin: technical analysis
21 January 2019, 10:15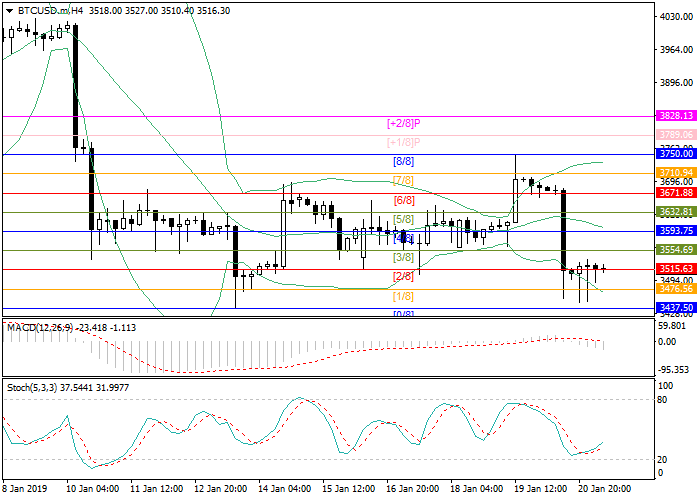
| Scenario | |
|---|---|
| Timeframe | Intraday |
| Recommendation | BUY STOP |
| Entry Point | 3600.00 |
| Take Profit | 3750.00 |
| Stop Loss | 3550.00 |
| Key Levels | 3359.38, 3398.44, 3437.50, 3476.56, 3554.69, 3593.75,3632.81, 3671.88 |
| Alternative scenario | |
|---|---|
| Recommendation | SELL STOP |
| Entry Point | 3435.00 |
| Take Profit | 3398.44, 3359.38 |
| Stop Loss | 3463.00 |
| Key Levels | 3359.38, 3398.44, 3437.50, 3476.56, 3554.69, 3593.75,3632.81, 3671.88 |
Current trend
After reaching the level of 3747.40, Bitcoin quotes dropped below the center line of Bollinger Bands and are trading around the level of 3515.63. Technical indicators mainly indicate the preservation of the downward trend potential, but an upward correction is likely. If buyers manage to return the rate above the level of 3593.75 (Murrey [4/8]), which coincides with the center line of Bollinger Bands, then the upward movement with a repeated test of the level of 3750.00 will be possible.
One may speak about the continuation of the downtrend after the price consolidates below 3437.50 (Murrey [0/8]). In this case, the next targets of the sellers will be the area of 3398.44 (Murrey [–1/8])–3359.38 (Murrey [–2/8]). Technical indicators point at the moderate preservation of the downward trend. Bollinger Bands are directed downwards. The volumes of MACD histogram are growing in the negative zone, forming a signal for sale. Stochastic is directed upwards indicating the probability of an upward correction development.
Support and resistance
Resistance levels: 3554.69, 3593.75, 3632.81, 3671.88.
Support levels: 3476.56, 3437.50, 3398.44, 3359.38.

Trading tips
Long positions may be opened above the level of 3593.75 with target at 3750.00 and stop loss at 3550.00.
Short positions may be opened below 3437.50 with targets at 3398.44–3359.38 and stop loss at 3463.00.
Implementation time: 2-3 days.
After reaching the level of 3747.40, Bitcoin quotes dropped below the center line of Bollinger Bands and are trading around the level of 3515.63. Technical indicators mainly indicate the preservation of the downward trend potential, but an upward correction is likely. If buyers manage to return the rate above the level of 3593.75 (Murrey [4/8]), which coincides with the center line of Bollinger Bands, then the upward movement with a repeated test of the level of 3750.00 will be possible.
One may speak about the continuation of the downtrend after the price consolidates below 3437.50 (Murrey [0/8]). In this case, the next targets of the sellers will be the area of 3398.44 (Murrey [–1/8])–3359.38 (Murrey [–2/8]). Technical indicators point at the moderate preservation of the downward trend. Bollinger Bands are directed downwards. The volumes of MACD histogram are growing in the negative zone, forming a signal for sale. Stochastic is directed upwards indicating the probability of an upward correction development.
Support and resistance
Resistance levels: 3554.69, 3593.75, 3632.81, 3671.88.
Support levels: 3476.56, 3437.50, 3398.44, 3359.38.
Trading tips
Long positions may be opened above the level of 3593.75 with target at 3750.00 and stop loss at 3550.00.
Short positions may be opened below 3437.50 with targets at 3398.44–3359.38 and stop loss at 3463.00.
Implementation time: 2-3 days.


No comments:
Write comments