
AUD/USD: the instrument shows ambiguous dynamics
21 January 2019, 09:04
| Scenario | |
|---|---|
| Timeframe | Intraday |
| Recommendation | BUY STOP |
| Entry Point | 0.7205 |
| Take Profit | 0.7300, 0.7350 |
| Stop Loss | 0.7170 |
| Key Levels | 0.7053, 0.7085, 0.7105, 0.7145, 0.7200, 0.7234, 0.7276, 0.7300 |
| Alternative scenario | |
|---|---|
| Recommendation | SELL STOP |
| Entry Point | 0.7140 |
| Take Profit | 0.7053, 0.7027, 0.7000 |
| Stop Loss | 0.7200 |
| Key Levels | 0.7053, 0.7085, 0.7105, 0.7145, 0.7200, 0.7234, 0.7276, 0.7300 |
Current trend
AUD finished last week's trading with a decline against USD, leveling Thursday's attempt of correctional growth.
In the absence of significant releases, AUD moves due to external factors. Investors are looking forward to the information on the possible abolition of increased duties on the Chinese goods in the US. The US-Chinese trade deal will have a positive effect on the Australian economy. With the long-term development of the conflict between its leading partners, Australia, according to experts, could lose 0.3% of GDP by 2022, which corresponds to USD 36 billion.
Today, the pair is trading in both directions. US markets are closed due to Martin Luther King, Jr. Day, so investors are focused on data from Australia and China. HIA New Home Sales in Australia went down by 6.7% MoM in December after the growth by 3.6% MoM in the previous month.
Support and resistance
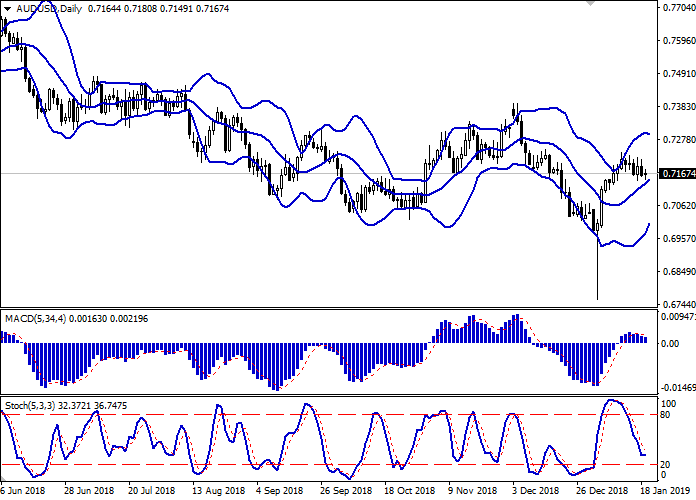
Bollinger Bands in D1 chart show stable growth. The price range is narrowing, reflecting the emergence of ambiguous dynamics of trading in the short term. MACD is going down keeping a moderate sell signal (located below the signal line). Stochastic having previously shown a steady decline, reversed into a horizontal plane, responding to the flat nature of trading today.
It is necessary to wait for the emergence of trade signals from the indicators to open new positions.
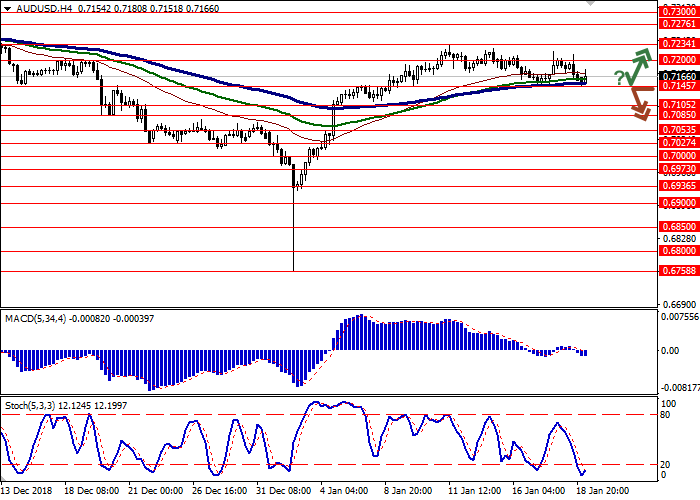
Resistance levels: 0.7200, 0.7234, 0.7276, 0.7300.
Support levels: 0.7145, 0.7105, 0.7085, 0.7053.
Trading tips
To open long positions, one can rely on the rebound from 0.7145 as from support with the subsequent breakout of 0.7200. Take profit — 0.7300 or 0.7350.
A breakdown of 0.7145 may be a signal to further sales with targets at 0.7053, 0.7027 or 0.7000. Stop loss — 0.7200.
Implementation period: 2-3 days.
AUD finished last week's trading with a decline against USD, leveling Thursday's attempt of correctional growth.
In the absence of significant releases, AUD moves due to external factors. Investors are looking forward to the information on the possible abolition of increased duties on the Chinese goods in the US. The US-Chinese trade deal will have a positive effect on the Australian economy. With the long-term development of the conflict between its leading partners, Australia, according to experts, could lose 0.3% of GDP by 2022, which corresponds to USD 36 billion.
Today, the pair is trading in both directions. US markets are closed due to Martin Luther King, Jr. Day, so investors are focused on data from Australia and China. HIA New Home Sales in Australia went down by 6.7% MoM in December after the growth by 3.6% MoM in the previous month.
Support and resistance
Bollinger Bands in D1 chart show stable growth. The price range is narrowing, reflecting the emergence of ambiguous dynamics of trading in the short term. MACD is going down keeping a moderate sell signal (located below the signal line). Stochastic having previously shown a steady decline, reversed into a horizontal plane, responding to the flat nature of trading today.
It is necessary to wait for the emergence of trade signals from the indicators to open new positions.
Resistance levels: 0.7200, 0.7234, 0.7276, 0.7300.
Support levels: 0.7145, 0.7105, 0.7085, 0.7053.
Trading tips
To open long positions, one can rely on the rebound from 0.7145 as from support with the subsequent breakout of 0.7200. Take profit — 0.7300 or 0.7350.
A breakdown of 0.7145 may be a signal to further sales with targets at 0.7053, 0.7027 or 0.7000. Stop loss — 0.7200.
Implementation period: 2-3 days.


No comments:
Write comments