
AUD/USD: the instrument is trading in both directions
30 January 2019, 08:38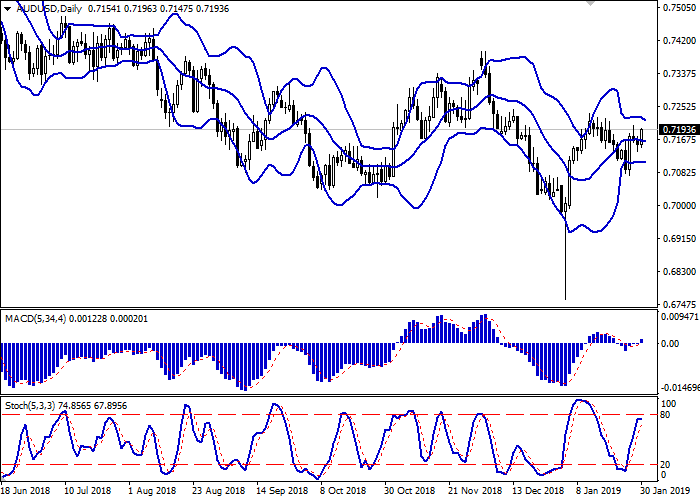
| Scenario | |
|---|---|
| Timeframe | Intraday |
| Recommendation | BUY STOP |
| Entry Point | 0.7205 |
| Take Profit | 0.7276, 0.7300 |
| Stop Loss | 0.7165 |
| Key Levels | 0.7075, 0.7115, 0.7136, 0.7165, 0.7200, 0.7234, 0.7276, 0.7300 |
| Alternative scenario | |
|---|---|
| Recommendation | SELL STOP |
| Entry Point | 0.7160, 0.7145 |
| Take Profit | 0.7100, 0.7075, 0.7053 |
| Stop Loss | 0.7200 |
| Key Levels | 0.7075, 0.7115, 0.7136, 0.7165, 0.7200, 0.7234, 0.7276, 0.7300 |
Current trend
AUD showed an uncertain decline against USD on Tuesday, which was a market reaction to the publication of not the strongest statistics from Australia. NAB Business Survey in December decreased from 11 to 2 points, which turned out to be worse than the average forecasts of experts.
Today, the pair is growing steadily. Statistics on consumer inflation from Australia provides support for AUD. According to the results of Q4 2018, CPI rose by 0.5% QoQ and 1.8% YoY, which was slightly better than market expectations (+0.4% QoQ and +1.7% YoY).
The instrument is also supported by the expectation of today's Fed monetary policy meeting. Investors do not expect to raise interest rates at the current meeting, but fear additional mitigation of the regulator’s positions.
Support and resistance
Bollinger Bands on the D1 chart demonstrate flat dynamics. The price range is narrowing, reflecting the ambiguous nature of trading in recent days. MACD indicator is growing keeping a stable buy signal (located above the signal line). The indicator is also trying to consolidate above the zero level. Stochastic, in turn, reversed into a horizontal plane, responding to the "bearish" start of the week.
It is necessary to wait for the clarification of the situation at the market.
Resistance levels: 0.7200, 0.7234, 0.7276, 0.7300.
Support levels: 0.7165, 0.7136, 0.7115, 0.7075.
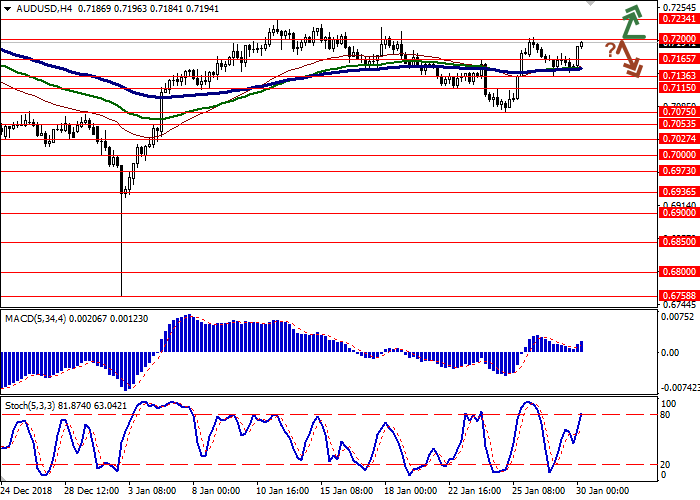

Trading tips
To open long positions one can rely on the breakout of 0.7200, while strengthening "bullish" signals from technical indicators. Take profit — 0.7276 or 0.7300. Stop loss — 0.7165.
The rebound from 0.7200 as from resistance with the subsequent breakdown of 0.7165 or 0.7150 can become a signal to begin correctional sales with target at 0.7100 or 0.7075, 0.7053. Stop loss — 0.7200.
Implementation period: 2-3 days.
AUD showed an uncertain decline against USD on Tuesday, which was a market reaction to the publication of not the strongest statistics from Australia. NAB Business Survey in December decreased from 11 to 2 points, which turned out to be worse than the average forecasts of experts.
Today, the pair is growing steadily. Statistics on consumer inflation from Australia provides support for AUD. According to the results of Q4 2018, CPI rose by 0.5% QoQ and 1.8% YoY, which was slightly better than market expectations (+0.4% QoQ and +1.7% YoY).
The instrument is also supported by the expectation of today's Fed monetary policy meeting. Investors do not expect to raise interest rates at the current meeting, but fear additional mitigation of the regulator’s positions.
Support and resistance
Bollinger Bands on the D1 chart demonstrate flat dynamics. The price range is narrowing, reflecting the ambiguous nature of trading in recent days. MACD indicator is growing keeping a stable buy signal (located above the signal line). The indicator is also trying to consolidate above the zero level. Stochastic, in turn, reversed into a horizontal plane, responding to the "bearish" start of the week.
It is necessary to wait for the clarification of the situation at the market.
Resistance levels: 0.7200, 0.7234, 0.7276, 0.7300.
Support levels: 0.7165, 0.7136, 0.7115, 0.7075.
Trading tips
To open long positions one can rely on the breakout of 0.7200, while strengthening "bullish" signals from technical indicators. Take profit — 0.7276 or 0.7300. Stop loss — 0.7165.
The rebound from 0.7200 as from resistance with the subsequent breakdown of 0.7165 or 0.7150 can become a signal to begin correctional sales with target at 0.7100 or 0.7075, 0.7053. Stop loss — 0.7200.
Implementation period: 2-3 days.


No comments:
Write comments