
AUD/USD: Australian dollar is strengthening
11 January 2019, 08:26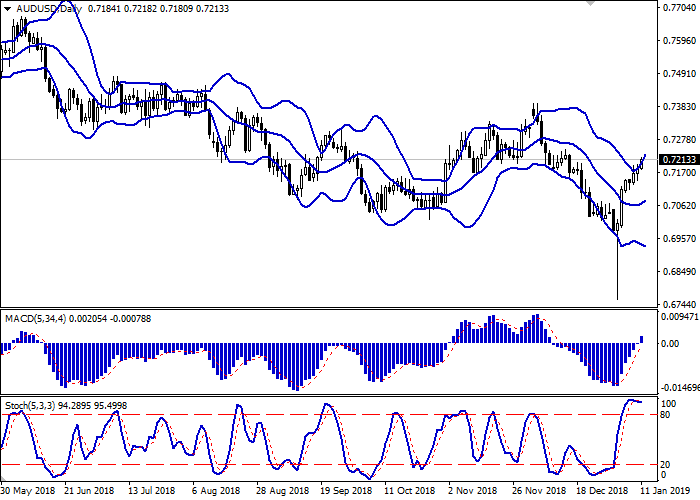
| Scenario | |
|---|---|
| Timeframe | Intraday |
| Recommendation | BUY STOP |
| Entry Point | 0.7250 |
| Take Profit | 0.7300, 0.7320 |
| Stop Loss | 0.7210 |
| Key Levels | 0.7105, 0.7130, 0.7150, 0.7200, 0.7245, 0.7276, 0.7300 |
| Alternative scenario | |
|---|---|
| Recommendation | SELL STOP |
| Entry Point | 0.7190, 0.7175 |
| Take Profit | 0.7105, 0.7085, 0.7053 |
| Stop Loss | 0.7245 |
| Key Levels | 0.7105, 0.7130, 0.7150, 0.7200, 0.7245, 0.7276, 0.7300 |
Current trend
AUD showed moderate growth against USD on Thursday, continuing the development of a rather active “bullish” trend, which began on January 3.
The growth of the instrument was prompted by quite alarming statements by Fed Chairman Jerome Powell, who focused on the risks for the American economy instead of discussing the prospects for further tightening of monetary policy. In particular, the official said that the regulator is concerned about the extremely high level of public debt, as well as the growing budget deficit, which currently exceeds USD 1 trillion.
During today's Asian session, the instrument continues to grow actively, despite the publication of ambiguous statistics from Australia. AiG Construction Index went down from 44.5 to 42.6 points in December. At the same time, Retail Sales in November unexpectedly rose to 0.4% MoM.
Support and resistance
Bollinger Bands in D1 chart show stable growth. The price range expands actively, freeing a path to new local highs for the "bulls". MACD indicator is growing, keeping a stable buy signal (located above the signal line). The indicator is also trying to consolidate above the zero level. Stochastic, having reached its highs, reversed into the horizontal plane, indicating risks of the overbought AUD.
Existing long positions should be kept until the situation clears up.
Resistance levels: 0.7245, 0.7276, 0.7300.
Support levels: 0.7200, 0.7150, 0.7130, 0.7105.
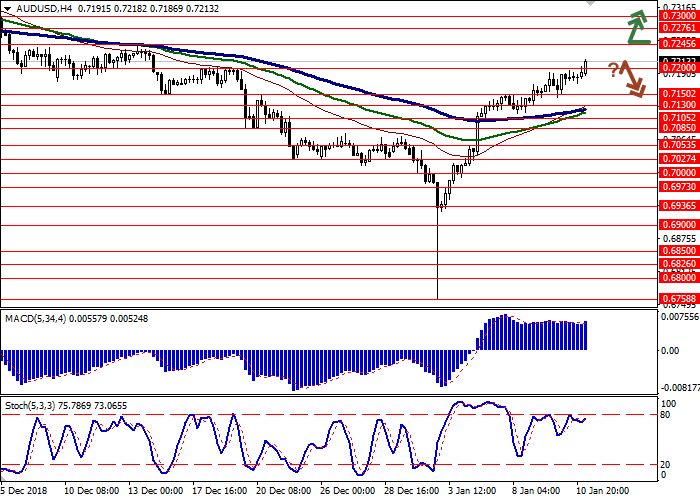

Trading tips
To open long positions, one can rely on the breakout of 0.7245. Take profit — 0.7300 or 0.7320. Stop loss — 0.7210. Implementation period: 1-2 days.
A reverse downwards near the current levels followed with a breakdown of 0.7200 or 0.7180 can be a signal to begin correctional sales with target at 0.7105, 0.7085 or 0.7053. Stop loss — 0.7245. Implementation period: 2-3 days.
AUD showed moderate growth against USD on Thursday, continuing the development of a rather active “bullish” trend, which began on January 3.
The growth of the instrument was prompted by quite alarming statements by Fed Chairman Jerome Powell, who focused on the risks for the American economy instead of discussing the prospects for further tightening of monetary policy. In particular, the official said that the regulator is concerned about the extremely high level of public debt, as well as the growing budget deficit, which currently exceeds USD 1 trillion.
During today's Asian session, the instrument continues to grow actively, despite the publication of ambiguous statistics from Australia. AiG Construction Index went down from 44.5 to 42.6 points in December. At the same time, Retail Sales in November unexpectedly rose to 0.4% MoM.
Support and resistance
Bollinger Bands in D1 chart show stable growth. The price range expands actively, freeing a path to new local highs for the "bulls". MACD indicator is growing, keeping a stable buy signal (located above the signal line). The indicator is also trying to consolidate above the zero level. Stochastic, having reached its highs, reversed into the horizontal plane, indicating risks of the overbought AUD.
Existing long positions should be kept until the situation clears up.
Resistance levels: 0.7245, 0.7276, 0.7300.
Support levels: 0.7200, 0.7150, 0.7130, 0.7105.
Trading tips
To open long positions, one can rely on the breakout of 0.7245. Take profit — 0.7300 or 0.7320. Stop loss — 0.7210. Implementation period: 1-2 days.
A reverse downwards near the current levels followed with a breakdown of 0.7200 or 0.7180 can be a signal to begin correctional sales with target at 0.7105, 0.7085 or 0.7053. Stop loss — 0.7245. Implementation period: 2-3 days.


No comments:
Write comments