
USD/CAD: wave analysis
07 December 2018, 08:39
| Scenario | |
|---|---|
| Timeframe | Weekly |
| Recommendation | SELL |
| Entry Point | 1.3392 |
| Take Profit | 1.2887 |
| Stop Loss | 1.3470 |
| Key Levels | 1.2887, 1.3470, 1.3574 |
| Alternative scenario | |
|---|---|
| Recommendation | BUY STOP |
| Entry Point | 1.3475 |
| Take Profit | 1.3574 |
| Stop Loss | 1.3440 |
| Key Levels | 1.2887, 1.3470, 1.3574 |
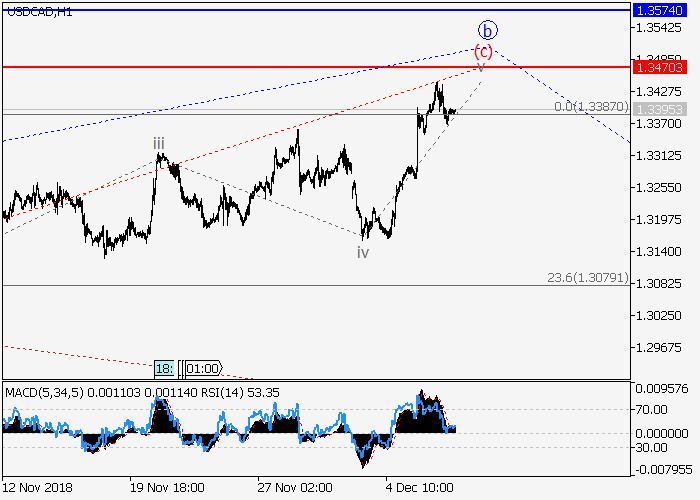
The pair may fall.
On the daily chart, a correction of the higher level develops as a wave 2, taking a flat shape. Now the formation of the wave b of 2 is ending, within which the ending wave of the lower level v of (c) of b is forming. If the assumption is correct, after the end of the correction, the pair will fall to the level of 1.2887. In this scenario, critical stop loss level is 1.3470.
Main scenario
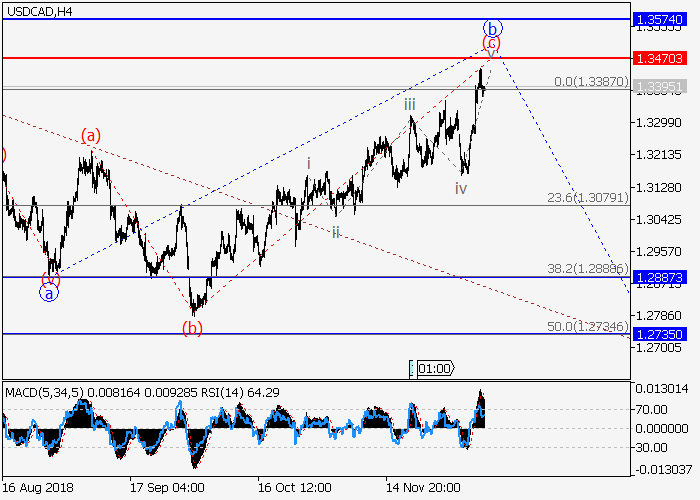
Short positions will become relevant below the level of 1.3470 with the target at 1.2887. Implementation period: 7 days and more.
Alternative scenario
The breakout and the consolidation of the price above the level of 1.3470 will let the pair grow to the level of 1.3574.
On the daily chart, a correction of the higher level develops as a wave 2, taking a flat shape. Now the formation of the wave b of 2 is ending, within which the ending wave of the lower level v of (c) of b is forming. If the assumption is correct, after the end of the correction, the pair will fall to the level of 1.2887. In this scenario, critical stop loss level is 1.3470.
Main scenario
Short positions will become relevant below the level of 1.3470 with the target at 1.2887. Implementation period: 7 days and more.
Alternative scenario
The breakout and the consolidation of the price above the level of 1.3470 will let the pair grow to the level of 1.3574.


No comments:
Write comments