NZD/USD: general review
07 December 2018, 08:27
| Scenario | |
|---|---|
| Timeframe | Intraday |
| Recommendation | SELL |
| Entry Point | 0.6877 |
| Take Profit | 0.6780 |
| Stop Loss | 0.6920 |
| Key Levels | 0.6737, 0.6780, 0.6820, 0.6846, 0.6859, 0.6874, 0.6908, 0.6975, 0.7015 |
| Alternative scenario | |
|---|---|
| Recommendation | BUY STOP |
| Entry Point | 0.6930 |
| Take Profit | 0.6975 |
| Stop Loss | 0.6905 |
| Key Levels | 0.6737, 0.6780, 0.6820, 0.6846, 0.6859, 0.6874, 0.6908, 0.6975, 0.7015 |
Current trend
On Thursday, the pair continued to decline amid aggravation of the US-China trade conflict.
NZD is pressured by the possibility of disrupting of the US-Chinese 90-day trading truce due to the arrest of Huawei’s CFO Meng Wanzhou in Canada. The continuation of the trade conflict will put pressure on the economy of New Zealand. USD is pressured by the Fed’s Beige Book, which recorded a slowdown in the American economy. The effects of tariff increases and the general trade policy of Donald Trump’s administration are named as the reasons for the recession. Thus, after recent statements of the regulator's head Jerome Powell that the rate is "just below" the neutral level, the market received another reason to fear a slowdown in the tightening of monetary policy.
Today at 15:30 (GMT+2) a number of labor market indicators will be published in the US. Investors will continue to monitor the development of the US-China trade war. Currently, the conflict of the two largest economies puts more pressure on commodity currencies than on USD.
Support and resistance
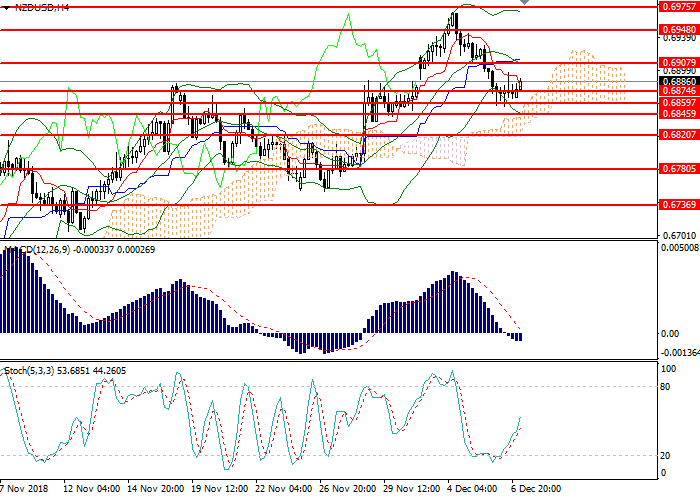
On the H4 chart the instrument is correcting in the lower part of Bollinger Bands. The indicator reverses downwards, and the price range has expanded, which is the basis for the further decline of the pair. MACD histogram is at the zero level and gives no clear signals for entering the market. Stochastic is approaching the overbought area; the signal for opening positions is not formed.
Resistance levels: 0.6908, 0.6975, 0.7015.
Support levels: 0.6874, 0.6859, 0.6846, 0.6820, 0.6780, 0.6737.

Trading tips
Short positions may be opened from the current level with target at 0.6780 and stop loss at 0.6920.
Long positions may be opened above 0.6925 with target at 0.6975 and stop loss at 0.6905.
Implementation time: 1-3 days.
On Thursday, the pair continued to decline amid aggravation of the US-China trade conflict.
NZD is pressured by the possibility of disrupting of the US-Chinese 90-day trading truce due to the arrest of Huawei’s CFO Meng Wanzhou in Canada. The continuation of the trade conflict will put pressure on the economy of New Zealand. USD is pressured by the Fed’s Beige Book, which recorded a slowdown in the American economy. The effects of tariff increases and the general trade policy of Donald Trump’s administration are named as the reasons for the recession. Thus, after recent statements of the regulator's head Jerome Powell that the rate is "just below" the neutral level, the market received another reason to fear a slowdown in the tightening of monetary policy.
Today at 15:30 (GMT+2) a number of labor market indicators will be published in the US. Investors will continue to monitor the development of the US-China trade war. Currently, the conflict of the two largest economies puts more pressure on commodity currencies than on USD.
Support and resistance
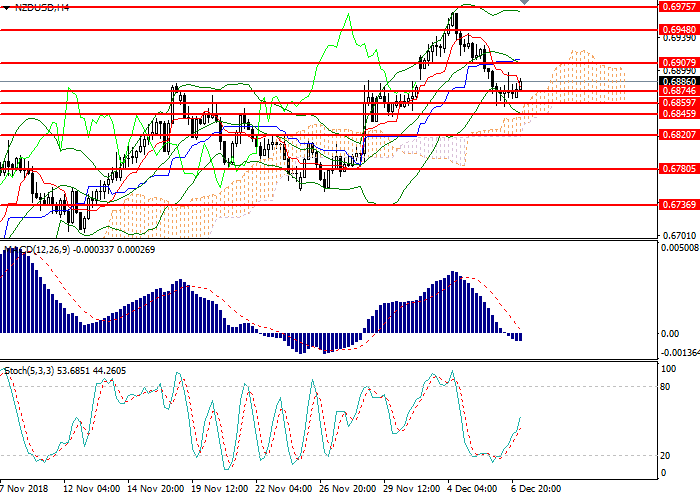
On the H4 chart the instrument is correcting in the lower part of Bollinger Bands. The indicator reverses downwards, and the price range has expanded, which is the basis for the further decline of the pair. MACD histogram is at the zero level and gives no clear signals for entering the market. Stochastic is approaching the overbought area; the signal for opening positions is not formed.
Resistance levels: 0.6908, 0.6975, 0.7015.
Support levels: 0.6874, 0.6859, 0.6846, 0.6820, 0.6780, 0.6737.

Trading tips
Short positions may be opened from the current level with target at 0.6780 and stop loss at 0.6920.
Long positions may be opened above 0.6925 with target at 0.6975 and stop loss at 0.6905.
Implementation time: 1-3 days.


No comments:
Write comments