
IBM Corp.: wave analysis
10 December 2018, 09:35
| Scenario | |
|---|---|
| Timeframe | Weekly |
| Recommendation | SELL |
| Entry Point | 119.29 |
| Take Profit | 107.00, 100.00 |
| Stop Loss | 126.60 |
| Key Levels | 100.00, 107.00, 126.60, 134.03, 138.58 |
| Alternative scenario | |
|---|---|
| Recommendation | BUY STOP |
| Entry Point | 126.70 |
| Take Profit | 134.03, 138.58 |
| Stop Loss | 124.25 |
| Key Levels | 100.00, 107.00, 126.60, 134.03, 138.58 |
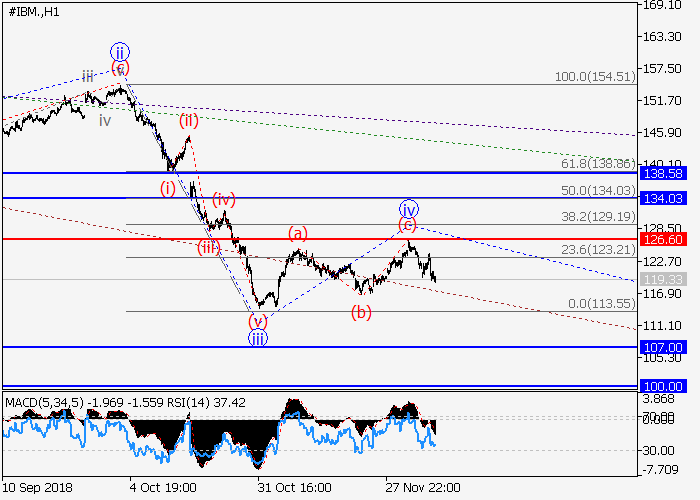
The probability of decline remains.
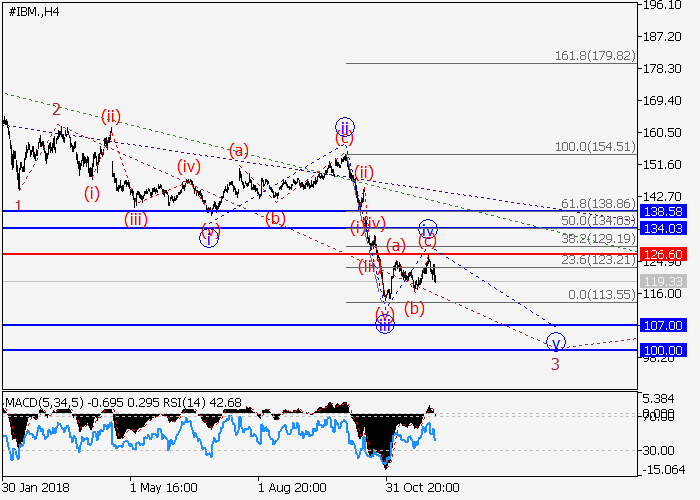
On the H4 chart, the downward trend continues to develop as the third wave of the higher level 3. At the moment, the third wave of the lower level iii of 3 has formed, and the upward correction iv of 3 is completed. If the assumption is correct, the decline will continue to the levels of 107.00–100.00 in the frame of wave v of 3. The critical level for this scenario is 126.60.
Main scenario
Short positions will become relevant below the level of 126.60 with a target in the range of 107.00–100.00. Implementation period: 7+ days.
Alternative scenario
Breakout and consolidation of the price above the level of 126.60 will allow the asset to grow to the levels of 134.03–138.58.


No comments:
Write comments