
EUR/USD: wave analysis
14 December 2018, 10:07
| Scenario | |
|---|---|
| Timeframe | Weekly |
| Recommendation | BUY |
| Entry Point | 1.1357 |
| Take Profit | 1.1511, 1.1586 |
| Stop Loss | 1.1306 |
| Key Levels | 1.1150, 1.1200, 1.1306, 1.1511, 1.1586 |
| Alternative scenario | |
|---|---|
| Recommendation | SELL STOP |
| Entry Point | 1.1300 |
| Take Profit | 1.1200, 1.1150 |
| Stop Loss | 1.1360 |
| Key Levels | 1.1150, 1.1200, 1.1306, 1.1511, 1.1586 |
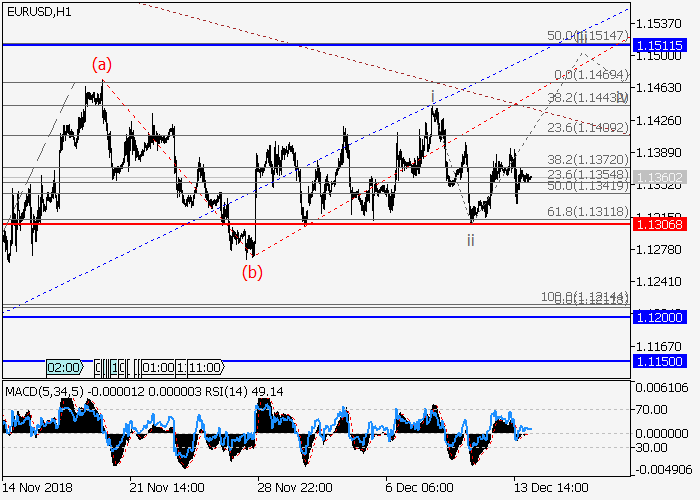
The pair is likely to grow.
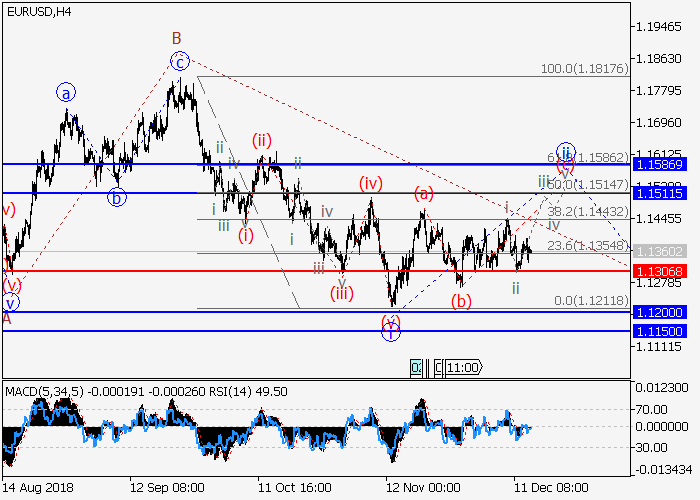
On 4-hour chart, the downward correction of the higher level is developing as a wave (2), which includes the wave C of (2). At the moment, it seems that the upward correction is forming as the second wave ii of C, within which wave (c) of ii is being formed. If the assumption is correct, the pair will continue to rise to the levels of 1.1511–1.1586. The critical level for this scenario is 1.1306.
Main scenario
Long positions will become relevant above the level of 1.1306 with a target in the range of 1.1511-1.1586. Implementation period: 5–7 days.
Alternative scenario
Breakdown and consolidation of the price below the level of 1.1306 will allow the pair to decline to the levels of 1.1200–1.1150.


No comments:
Write comments