
AUD/USD: wave analysis
18 December 2018, 10:54
| Scenario | |
|---|---|
| Timeframe | Weekly |
| Recommendation | SELL |
| Entry Point | 0.7199 |
| Take Profit | 0.7105, 0.7025 |
| Stop Loss | 0.7243 |
| Key Levels | 0.7025, 0.7105, 0.7243, 0.7305, 0.7450 |
| Alternative scenario | |
|---|---|
| Recommendation | BUY STOP |
| Entry Point | 0.7250 |
| Take Profit | 0.7305, 0.7450 |
| Stop Loss | 0.7220 |
| Key Levels | 0.7025, 0.7105, 0.7243, 0.7305, 0.7450 |
The probability of decline remains.
On the H4 chart, the upward correction is developing as a wave 2 of (5). At the moment, it seems that the b of 2 wave is developing in the form of a zigzag, within which the wave (c) of b is being formed. If the assumption is correct, then the pair can decline to the levels of 0.7105–0.7025. The critical level for this scenario is the level of 0.7243.
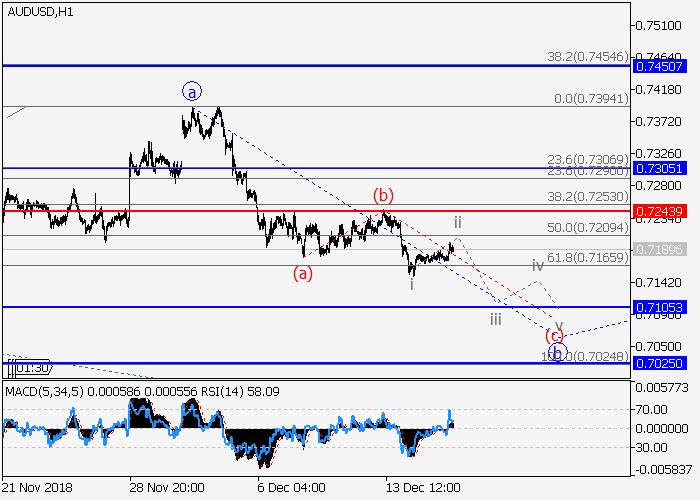
Main scenario
Short positions will become relevant below the level of 0.7243 with a target in the range of 0.7105–0.7025. Implementation period: 3–5 days.
Alternative scenario
Breakout and consolidation of the price above the level of 0.7243 will allow the pair to grow to the levels of 0.7305–0.7450.
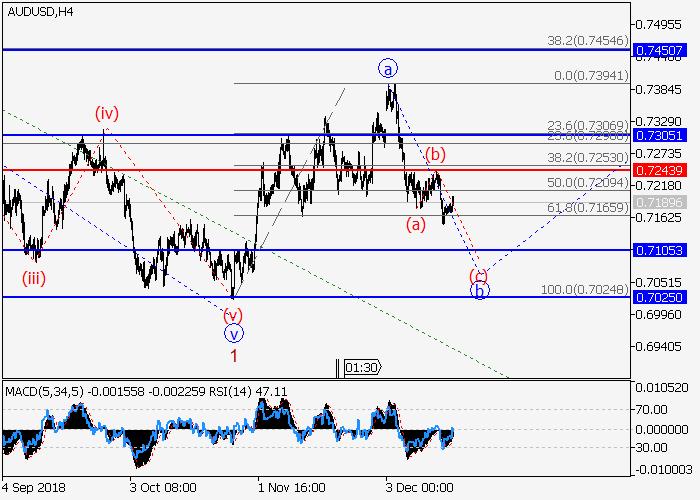
On the H4 chart, the upward correction is developing as a wave 2 of (5). At the moment, it seems that the b of 2 wave is developing in the form of a zigzag, within which the wave (c) of b is being formed. If the assumption is correct, then the pair can decline to the levels of 0.7105–0.7025. The critical level for this scenario is the level of 0.7243.
Main scenario
Short positions will become relevant below the level of 0.7243 with a target in the range of 0.7105–0.7025. Implementation period: 3–5 days.
Alternative scenario
Breakout and consolidation of the price above the level of 0.7243 will allow the pair to grow to the levels of 0.7305–0.7450.


No comments:
Write comments