
Apple Inc.: wave analysis
13 December 2018, 10:35
| Scenario | |
|---|---|
| Timeframe | Weekly |
| Recommendation | BUY |
| Entry Point | 169.07 |
| Take Profit | 184.80, 194.82 |
| Stop Loss | 162.50 |
| Key Levels | 146.00, 162.50, 184.80, 194.82 |
| Alternative scenario | |
|---|---|
| Recommendation | SELL STOP |
| Entry Point | 162.40 |
| Take Profit | 146.00 |
| Stop Loss | 167.90 |
| Key Levels | 146.00, 162.50, 184.80, 194.82 |
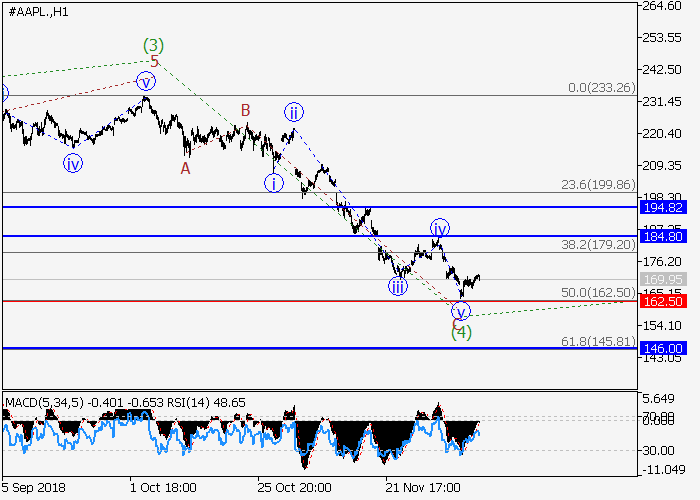
The probability of the increase remains high.
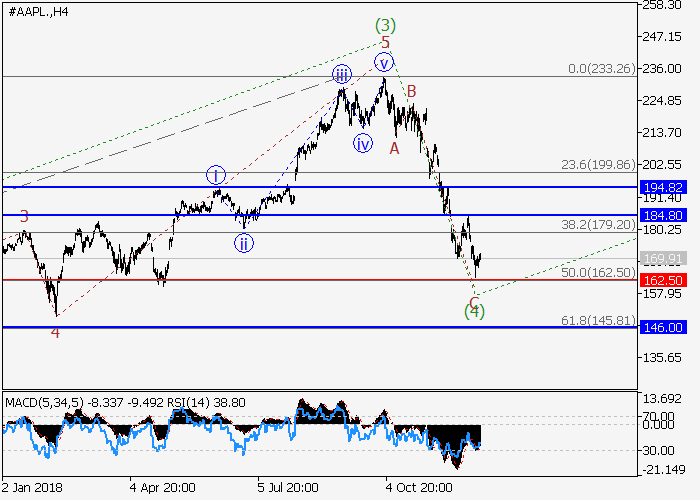
On the H4 chart the downward correction as a wave (4) has taken the form of a zigzag with an elongated wave C of 4. At the moment, the fifth wave of the lower level v of C has been completed. The growth of price may continue to the levels of 184.80–194.82. The critical level for this scenario is 162.50.
Main scenario
Long positions will become relevant above the level of 162.50 with the target within the range of 184.80-194.82. Implementation period: 5–7 days.
Alternative scenario
Breakdown and consolidation of the price below the level of 162.50 will allow the asset to continue to decline to 146.00.


No comments:
Write comments