
XAU/USD: gold prices are growing
20 August 2018, 09:31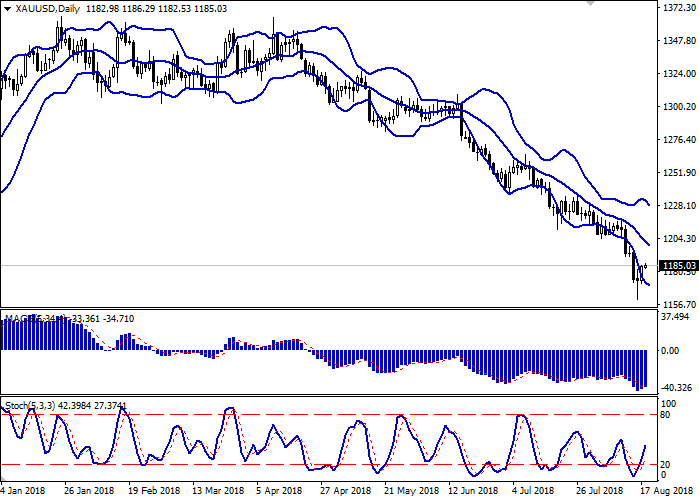
| Scenario | |
|---|---|
| Timeframe | Intraday |
| Recommendation | BUY STOP |
| Entry Point | 1188.00 |
| Take Profit | 1200.00, 1204.55 |
| Stop Loss | 1179.96 |
| Key Levels | 1187.96, 1194.68, 1200.00, 1204.55, 1159.83, 1170.00, 1179.96 |
| Alternative scenario | |
|---|---|
| Recommendation | SELL STOP |
| Entry Point | 1179.90 |
| Take Profit | 1170.00, 1159.83 |
| Stop Loss | 1190.00 |
| Key Levels | 1187.96, 1194.68, 1200.00, 1204.55, 1159.83, 1170.00, 1179.96 |
Current trend
Gold prices grew moderately on Friday, continuing the development of correction formed the day before when the quotes reached record lows.
The instrument was supported by the weakening of the dollar, as well as by corrective sentiments before the weekend. In turn, the continuing tension in the US-China relations pushes the gold to further growth.
The market is focused on the meeting of the United States and the PRC, which will be held on August 21-22, but analysts' forecasts remain disappointing. If negotiations fail, new import duties will enter into force on August 23 already, which will help restore the "bearish" trend.
Support and resistance
Bollinger Bands in D1 chart show moderate growth. The price range is narrowing from above, reflecting a sharp change of trend in the short term.
The MACD indicator turned up forming a weak buy signal (the histogram is located above the signal line).
Stochastic shows similar dynamics, keeping a stable upward direction and being located approximately at the center of its working area.
At the beginning of the week, a corrective growth in the short and/or ultra-short term is possible.
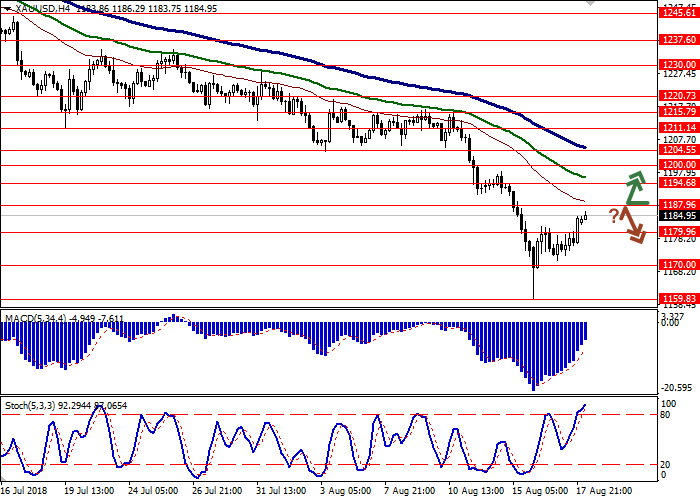
Resistance levels: 1187.96, 1194.68, 1200.00, 1204.55.
Support levels: 1179.96, 1170.00, 1159.83.

Trading tips
To open long positions, one can rely on the breakout of the level of 1187.96 while maintaining the "bullish" signals from the technical indicators. Take-profit — 1200.00 or 1204.55. Stop loss – 1179.96. Implementation time: 1-2 days.
A rebound from the level of 1187.96, as from resistance, followed by a breakdown of 1179.96, may become a signal for corrective sales with the target at 1170.00 or 1159.83. Stop loss – 1190.00. Implementation time: 2-3 days.
Gold prices grew moderately on Friday, continuing the development of correction formed the day before when the quotes reached record lows.
The instrument was supported by the weakening of the dollar, as well as by corrective sentiments before the weekend. In turn, the continuing tension in the US-China relations pushes the gold to further growth.
The market is focused on the meeting of the United States and the PRC, which will be held on August 21-22, but analysts' forecasts remain disappointing. If negotiations fail, new import duties will enter into force on August 23 already, which will help restore the "bearish" trend.
Support and resistance
Bollinger Bands in D1 chart show moderate growth. The price range is narrowing from above, reflecting a sharp change of trend in the short term.
The MACD indicator turned up forming a weak buy signal (the histogram is located above the signal line).
Stochastic shows similar dynamics, keeping a stable upward direction and being located approximately at the center of its working area.
At the beginning of the week, a corrective growth in the short and/or ultra-short term is possible.
Resistance levels: 1187.96, 1194.68, 1200.00, 1204.55.
Support levels: 1179.96, 1170.00, 1159.83.
Trading tips
To open long positions, one can rely on the breakout of the level of 1187.96 while maintaining the "bullish" signals from the technical indicators. Take-profit — 1200.00 or 1204.55. Stop loss – 1179.96. Implementation time: 1-2 days.
A rebound from the level of 1187.96, as from resistance, followed by a breakdown of 1179.96, may become a signal for corrective sales with the target at 1170.00 or 1159.83. Stop loss – 1190.00. Implementation time: 2-3 days.


No comments:
Write comments