
USD/CAD: general analysis
07 August 2018, 13:40
| Scenario | |
|---|---|
| Timeframe | Intraday |
| Recommendation | SELL |
| Entry Point | 1.2969 |
| Take Profit | 1.2910 |
| Stop Loss | 1.3000 |
| Key Levels | 1.2910, 1.2930, 1.2950, 1.2970, 1.3000, 1.3030, 1.3050, 1.3080, 1.3100 |
| Alternative scenario | |
|---|---|
| Recommendation | BUY STOP |
| Entry Point | 1.3050 |
| Take Profit | 1.3100 |
| Stop Loss | 1.3020 |
| Key Levels | 1.2910, 1.2930, 1.2950, 1.2970, 1.3000, 1.3030, 1.3050, 1.3080, 1.3100 |
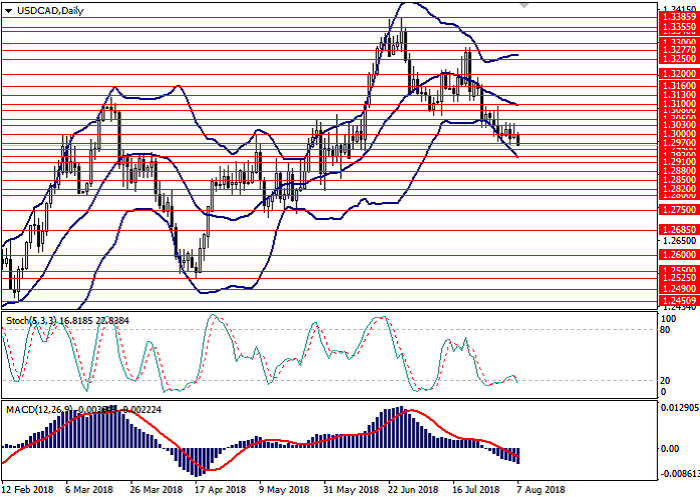
Current trend
CAD is strengthening against USD due to the growth of oil prices. The pair managed to consolidate below the level of 1.3000 after reports of the new US sanctions against Iran implementation. The main factor that influences the further movement of the pair is the NAFTA negotiations: the proximity of the agreement can provide additional support for CAD.
Today, traders should pay attention to the release of Canadian Ivey Purchasing Managers Index (16:00 GMT+2), the market expects moderate volatility.
Support and resistance
On the daily chart, the instrument falls along the lower border of Bollinger bands, the price range expands, reflecting a possible continuation of the downward movement. MACD histogram is in the negative area, keeping the signal to the opening of short positions.
Resistance levels: 1.3000, 1.3030, 1.3050, 1.3080, 1.3100.
Support levels: 1.2970, 1.2950, 1.2930, 1.2910.
Trading tips
Short positions can be opened from the current level with the target at 1.2910. Stop loss is 1.3000.
Long positions can be opened from the level of 1.3050 with the target at 1.3100 and stop loss 1.3020.
Implementation period: 1–3 days.


No comments:
Write comments