
Snap Inc. (SNAP/NYSE): general analysis
16 August 2018, 12:13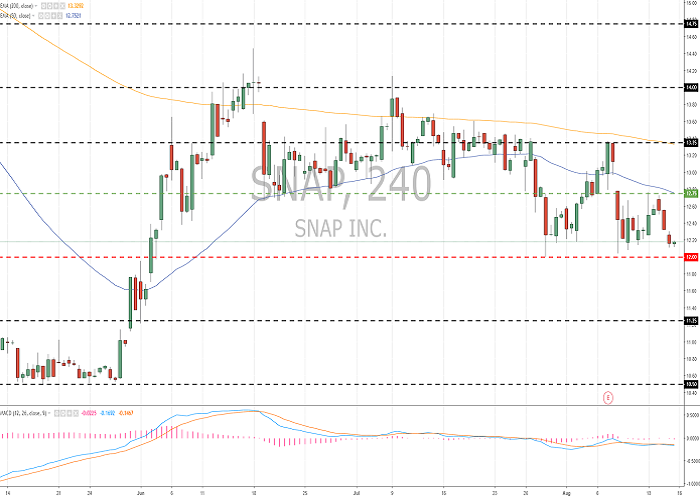
| Scenario | |
|---|---|
| Timeframe | Intraday |
| Recommendation | SELL STOP |
| Entry Point | 11.90 |
| Take Profit | 11.50, 11.00, 10.75 |
| Stop Loss | 12.50 |
| Key Levels | 10.50, 11.25, 12.00, 12.75, 13.35, 14.00 |
| Alternative scenario | |
|---|---|
| Recommendation | BUY STOP |
| Entry Point | 12.80 |
| Take Profit | 13.50, 14.00 |
| Stop Loss | 12.25 |
| Key Levels | 10.50, 11.25, 12.00, 12.75, 13.35, 14.00 |
Current trend
Since last week, Snap Inc. stocks have been trading a 3-month minimum due to the publication of the Q2 financial report. The price is under pressure of the decrease in the number of daytime active users by 2% YoY to 188 million people, which is attributed to the recent Snapchat redesign. The company's revenue increased by 44% YoY to $262 million, adjusted loss per share was $0.14, and both indicators were better than market expectations.
During the last week, Snap Inc. decreased by 0.41% against fall of S&P 500 index by 1.39%.
Support and resistance
Since the beginning of this month, the instrument has been moving sideways. At the moment, #SNAP prices are testing the round level at 12.00. The level of 12.75 is the nearest resistance. There is a potential for further decline. Indicators do not give a clear signal: the price was fixed below MA (50) and MA (200); MACD histogram is near the zero line. It is better to open the positions from the key levels.
The comparative analysis of the indicators of the company and its competitors suggests the neutrality of its share prices.
Resistance levels: 12.75, 13.35, 14.00.
Support levels: 12.00, 11.25, 10.50.

Trading tips
Short positions can be opened after the price is set below the level of 12.00. The closing of profitable positions is possible at the levels of 11.50, 11.00 and 10.75. Stop loss is 12.50.
Long positions can be opened after the price is fixed above the level of 12.75 with the targets at 13.50–14.00. Stop loss is 12.25.
Implementation period: 3 days.
Since last week, Snap Inc. stocks have been trading a 3-month minimum due to the publication of the Q2 financial report. The price is under pressure of the decrease in the number of daytime active users by 2% YoY to 188 million people, which is attributed to the recent Snapchat redesign. The company's revenue increased by 44% YoY to $262 million, adjusted loss per share was $0.14, and both indicators were better than market expectations.
During the last week, Snap Inc. decreased by 0.41% against fall of S&P 500 index by 1.39%.
Support and resistance
Since the beginning of this month, the instrument has been moving sideways. At the moment, #SNAP prices are testing the round level at 12.00. The level of 12.75 is the nearest resistance. There is a potential for further decline. Indicators do not give a clear signal: the price was fixed below MA (50) and MA (200); MACD histogram is near the zero line. It is better to open the positions from the key levels.
The comparative analysis of the indicators of the company and its competitors suggests the neutrality of its share prices.
Resistance levels: 12.75, 13.35, 14.00.
Support levels: 12.00, 11.25, 10.50.
Trading tips
Short positions can be opened after the price is set below the level of 12.00. The closing of profitable positions is possible at the levels of 11.50, 11.00 and 10.75. Stop loss is 12.50.
Long positions can be opened after the price is fixed above the level of 12.75 with the targets at 13.50–14.00. Stop loss is 12.25.
Implementation period: 3 days.


No comments:
Write comments