
USD/JPY: the pair shows mixed trend
14 May 2018, 09:37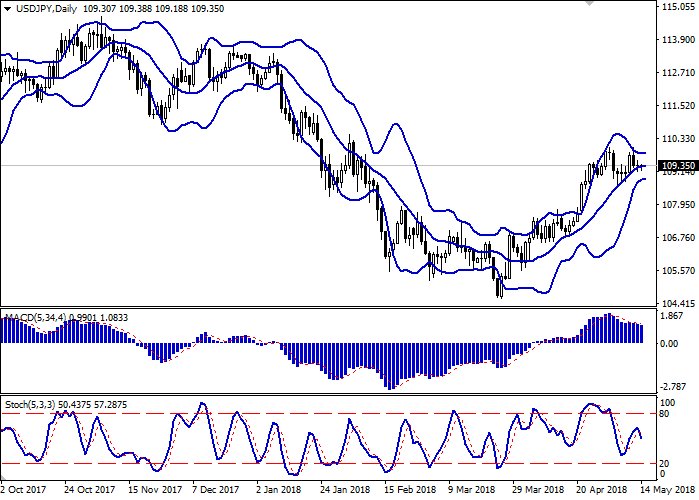
| Scenario | |
|---|---|
| Timeframe | Intraday |
| Recommendation | BUY STOP |
| Entry Point | 109.55 |
| Take Profit | 110.00 |
| Stop Loss | 109.20 |
| Key Levels | 108.26, 108.52, 108.94, 109.25, 109.52, 109.76, 110.00 |
| Alternative scenario | |
|---|---|
| Recommendation | SELL STOP |
| Entry Point | 109.20, 108.90 |
| Take Profit | 108.52, 108.26, 108.00 |
| Stop Loss | 109.50, 109.70 |
| Key Levels | 108.26, 108.52, 108.94, 109.25, 109.52, 109.76, 110.00 |
Current trend
USD is trading in different directions against JPY today, showing flat dynamics of last Friday.
As there is lack of key economic releases, US investors are focused on American April inflation data. The decrease of base CPI from 0.2% to 0.1% MoM and maintenance at 2.1% YoY may be a negative factor for the economy, but will barely make Fed’s official refuse from the interest growth rate speed. Many experts suppose the regulator will increase it three more times this year.
Today, traders focus on the speeches of the Fed's representatives Loretta Meister and James Bullard, who will unveil their point of view on the further vector of monetary policy due to the latest publications.
Support and resistance
On the D1 chart Bollinger Bands are reversing horizontally. The price range is narrowing, reflecting the mixed nature of trading and low activity in the market in general.
MACD is going down preserving a weak sell signal (histogram is located below the signal line).
Stochastic, after a short growth, reversed downwards, reacting to the predominantly "bearish" nature of trading at the end of last week.
At the moment, the indicators do not contradict the development of the downward correction in the short or ultra-short term.
Resistance levels: 109.52, 109.76, 110.00.
Support levels: 109.25, 108.94, 108.52, 108.26.
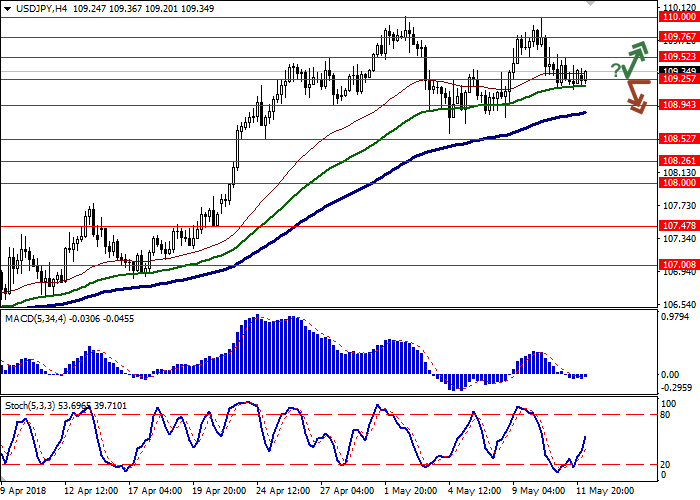

Trading tips
To open long positions, one can rely on the rebound from the support level of 109.25, with the subsequent breakout of the 109.52 mark. Take-profit — 110.00. Stop-loss — 109.20. Implementation period: 1-2 days.
Confident breakdown of the levels of 109.25, 109.00 can become a signal for the development of corrective sales with the targets at 108.52 or 108.26, 108.00. Stop-loss — 109.50 or 109.70. Implementation period: 2-3 days.
USD is trading in different directions against JPY today, showing flat dynamics of last Friday.
As there is lack of key economic releases, US investors are focused on American April inflation data. The decrease of base CPI from 0.2% to 0.1% MoM and maintenance at 2.1% YoY may be a negative factor for the economy, but will barely make Fed’s official refuse from the interest growth rate speed. Many experts suppose the regulator will increase it three more times this year.
Today, traders focus on the speeches of the Fed's representatives Loretta Meister and James Bullard, who will unveil their point of view on the further vector of monetary policy due to the latest publications.
Support and resistance
On the D1 chart Bollinger Bands are reversing horizontally. The price range is narrowing, reflecting the mixed nature of trading and low activity in the market in general.
MACD is going down preserving a weak sell signal (histogram is located below the signal line).
Stochastic, after a short growth, reversed downwards, reacting to the predominantly "bearish" nature of trading at the end of last week.
At the moment, the indicators do not contradict the development of the downward correction in the short or ultra-short term.
Resistance levels: 109.52, 109.76, 110.00.
Support levels: 109.25, 108.94, 108.52, 108.26.
Trading tips
To open long positions, one can rely on the rebound from the support level of 109.25, with the subsequent breakout of the 109.52 mark. Take-profit — 110.00. Stop-loss — 109.20. Implementation period: 1-2 days.
Confident breakdown of the levels of 109.25, 109.00 can become a signal for the development of corrective sales with the targets at 108.52 or 108.26, 108.00. Stop-loss — 109.50 or 109.70. Implementation period: 2-3 days.


No comments:
Write comments