
USD/JPY: dollar is dropping
30 May 2018, 09:29
| Scenario | |
|---|---|
| Timeframe | Intraday |
| Recommendation | BUY STOP |
| Entry Point | 109.00 |
| Take Profit | 109.76, 110.00 |
| Stop Loss | 108.50 |
| Key Levels | 108.00, 108.26, 108.52, 108.92, 109.25, 109.76, 110.00 |
| Alternative scenario | |
|---|---|
| Recommendation | SELL STOP |
| Entry Point | 108.45, 108.25 |
| Take Profit | 108.00, 107.70, 107.50 |
| Stop Loss | 108.70, 108.90 |
| Key Levels | 108.00, 108.26, 108.52, 108.92, 109.25, 109.76, 110.00 |
Current trend
USD showed a stable decrease against JPY on Tuesday, updating the local low of April 23. However, the instrument failed to keep its positions, and by the moment of closing of the daily session it had regained half of its losses.
Development of the "bearish" trend on the instrument yesterday was promoted by heterogeneous macroeconomic statistics from Japan. Unemployment rate stayed on the level of 2.5% in April. Jobs/applicants ratio stayed on the level of 1.59 points in April.
Today, the pair is once again trading in a downward direction, and strong statistics on retail sales are supporting the yen. In April, sales increased by 1.4% MoM and 1.6% YoY which was significantly better than market expectations (0.0% MoM and +1.0% YoY).
Support and resistance
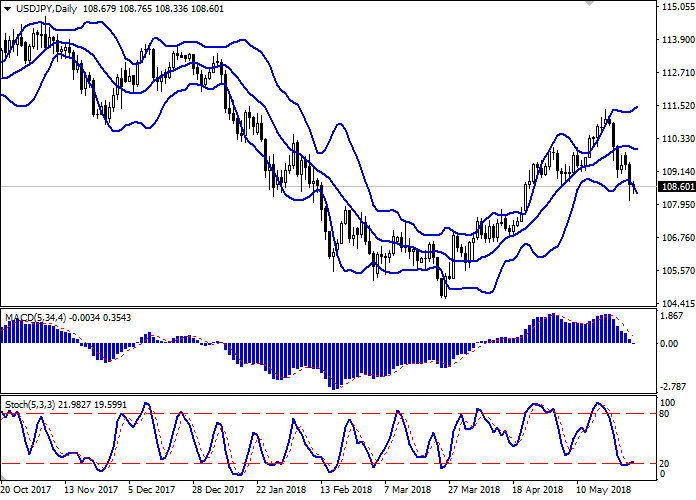
Bollinger Bands in D1 chart demonstrate flat dynamics. The price range is widening but does not conform to the development of the "bearish" trend yet.
MACD is going down keeping a stable sell signal (being located below the signal line). In addition, the indicator is trying to gain a foothold below the zero mark at the moment.
Stochastic is reversing upwards, reaching the mark "20", indicating the oversold USD in the short term.
It is worth looking into the possibility of corrective growth in the short and/or ultra-short term.
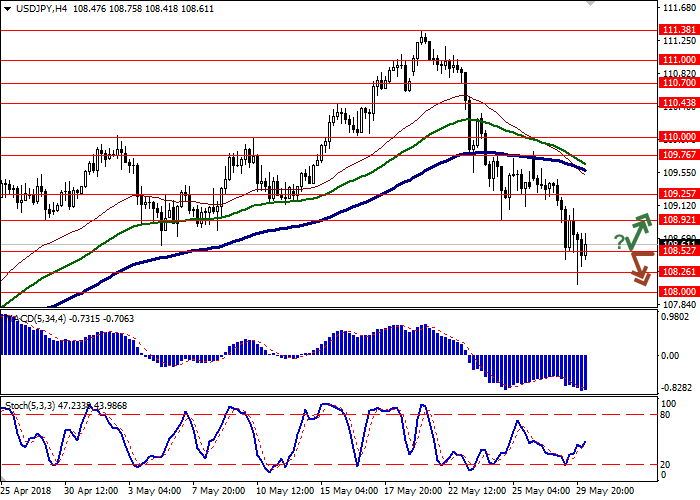
Resistance levels: 108.92, 109.25, 109.76, 110.00.
Support levels: 108.52, 108.26, 108.00.
Trading tips
Long positions may be opened if the instrument rebounds from the level of 108.52 followed by the breakout of 108.92 mark. Take-profit – 109.76 or 110.00. Stop-loss – 108.50.
A breakdown of the level of 108.52–108.30 may be a signal to further sales with targets at 108.00 or 107.70, 107.50 marks. Stop-loss – 108.70 or 108.90.
Implementation period: 2-3 days.
USD showed a stable decrease against JPY on Tuesday, updating the local low of April 23. However, the instrument failed to keep its positions, and by the moment of closing of the daily session it had regained half of its losses.
Development of the "bearish" trend on the instrument yesterday was promoted by heterogeneous macroeconomic statistics from Japan. Unemployment rate stayed on the level of 2.5% in April. Jobs/applicants ratio stayed on the level of 1.59 points in April.
Today, the pair is once again trading in a downward direction, and strong statistics on retail sales are supporting the yen. In April, sales increased by 1.4% MoM and 1.6% YoY which was significantly better than market expectations (0.0% MoM and +1.0% YoY).
Support and resistance
Bollinger Bands in D1 chart demonstrate flat dynamics. The price range is widening but does not conform to the development of the "bearish" trend yet.
MACD is going down keeping a stable sell signal (being located below the signal line). In addition, the indicator is trying to gain a foothold below the zero mark at the moment.
Stochastic is reversing upwards, reaching the mark "20", indicating the oversold USD in the short term.
It is worth looking into the possibility of corrective growth in the short and/or ultra-short term.
Resistance levels: 108.92, 109.25, 109.76, 110.00.
Support levels: 108.52, 108.26, 108.00.
Trading tips
Long positions may be opened if the instrument rebounds from the level of 108.52 followed by the breakout of 108.92 mark. Take-profit – 109.76 or 110.00. Stop-loss – 108.50.
A breakdown of the level of 108.52–108.30 may be a signal to further sales with targets at 108.00 or 107.70, 107.50 marks. Stop-loss – 108.70 or 108.90.
Implementation period: 2-3 days.


No comments:
Write comments