
USD/CHF: technical analysis
29 May 2018, 10:59
| Scenario | |
|---|---|
| Timeframe | Weekly |
| Recommendation | BUY STOP |
| Entry Point | 0.9955 |
| Take Profit | 1.0030, 1.0050 |
| Stop Loss | 0.9935 |
| Key Levels | 0.9825, 0.9840, 0.9880, 0.9955, 1.0030, 1.0050 |
| Alternative scenario | |
|---|---|
| Recommendation | SELL STOP |
| Entry Point | 0.9880 |
| Take Profit | 0.9840, 0.9825 |
| Stop Loss | 0.9900 |
| Key Levels | 0.9825, 0.9840, 0.9880, 0.9955, 1.0030, 1.0050 |
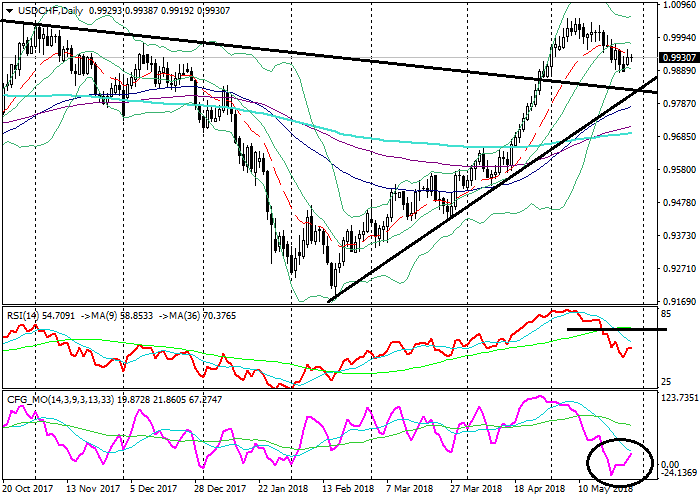
USD/CHF, D1
On the daily chart, the pair is trading in the lower Bollinger band. The price remains above the EMA65, EMA130 and SMA200 that are directed up. The RSI is falling, having left the overbought zone. The Composite turned up, having reached its critical oversold levels.
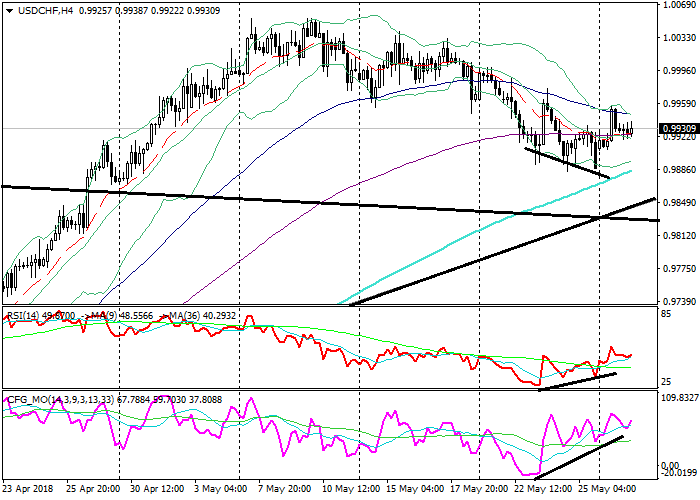
USD/CHF, H4
On the 4-hour chart, the pair is trading in the upper Bollinger band. The price remains on the level with the EMA14, EMA65 and EMA130 that are horizontal, and slightly above the SMA200 which is directed up. The RSI is growing, having formed a Bullish divergence with the price. The Composite is showing similar dynamics.
Key levels
Support levels: 0.9880 (local lows), 0.9840 (January highs), 0.9825 (local lows).
Resistance levels: 0.9955 (local highs), 1.0030 (November 2017 highs), 1.0050 (local highs).
Trading tips
There is a chance of an upward correction.
Long positions can be opened from the level of 0.9955 with targets at 1.0030, 1.0050 and stop-loss at 0.9935. Validity – 3-5 days.
Short positions can be opened from the level of 0.9880 with targets at 0.9840, 0.9825 and stop-loss at 0.9900. Validity – 3-5 days.
On the daily chart, the pair is trading in the lower Bollinger band. The price remains above the EMA65, EMA130 and SMA200 that are directed up. The RSI is falling, having left the overbought zone. The Composite turned up, having reached its critical oversold levels.
USD/CHF, H4
On the 4-hour chart, the pair is trading in the upper Bollinger band. The price remains on the level with the EMA14, EMA65 and EMA130 that are horizontal, and slightly above the SMA200 which is directed up. The RSI is growing, having formed a Bullish divergence with the price. The Composite is showing similar dynamics.
Key levels
Support levels: 0.9880 (local lows), 0.9840 (January highs), 0.9825 (local lows).
Resistance levels: 0.9955 (local highs), 1.0030 (November 2017 highs), 1.0050 (local highs).
Trading tips
There is a chance of an upward correction.
Long positions can be opened from the level of 0.9955 with targets at 1.0030, 1.0050 and stop-loss at 0.9935. Validity – 3-5 days.
Short positions can be opened from the level of 0.9880 with targets at 0.9840, 0.9825 and stop-loss at 0.9900. Validity – 3-5 days.


No comments:
Write comments