
USD/CAD: wave analysis
08 May 2018, 09:34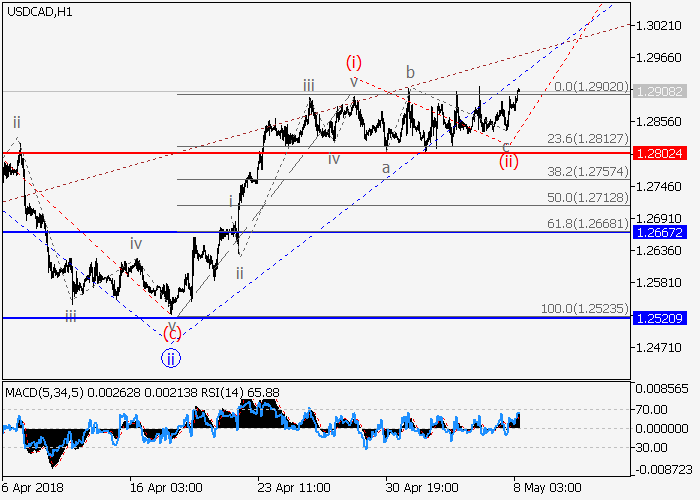
| Scenario | |
|---|---|
| Timeframe | Weekly |
| Recommendation | BUY |
| Entry Point | 1.2900 |
| Take Profit | 1.3126 |
| Stop Loss | 1.2802 |
| Key Levels | 1.2667, 1.2802, 1.3126 |
| Alternative scenario | |
|---|---|
| Recommendation | SELL STOP |
| Entry Point | 1.2795 |
| Take Profit | 1.2667 |
| Stop Loss | 1.2860 |
| Key Levels | 1.2667, 1.2802, 1.3126 |
The correction has ended, the pair can grow.
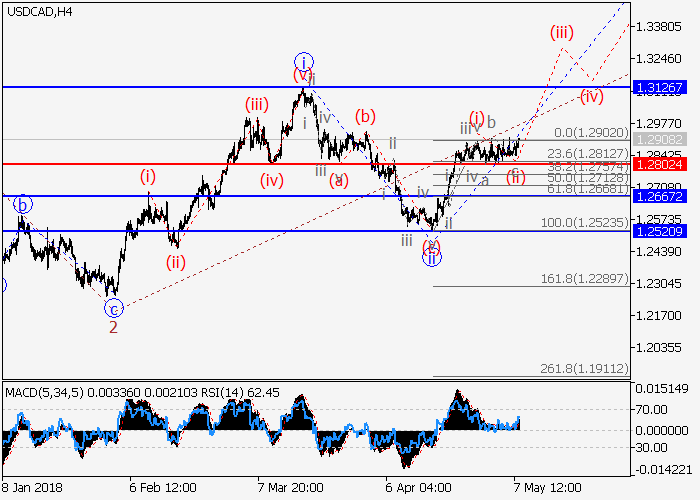
On the 4-hour chart, the upward trend is developing within the third wave of the higher level 3. Now the third wave of the lower level iii of 3 is forming, within which a momentum has formed as a wave (i) of iii, and the development of the local correction as a wave (ii) of iii has ended. If the assumption is correct, the pair will grow to the level of 1.3126. The level of 1.2802 is critical and stop-loss for this scenario.

Main scenario
Long positions will become relevant above the level of 1.2802 with the target at 1.3126. Implementation period: 5–7 days.
Alternative scenario
The breakdown and the consolidation of the price below the level of 1.2802 will let the pair go down to the level of 1.2667.
On the 4-hour chart, the upward trend is developing within the third wave of the higher level 3. Now the third wave of the lower level iii of 3 is forming, within which a momentum has formed as a wave (i) of iii, and the development of the local correction as a wave (ii) of iii has ended. If the assumption is correct, the pair will grow to the level of 1.3126. The level of 1.2802 is critical and stop-loss for this scenario.
Main scenario
Long positions will become relevant above the level of 1.2802 with the target at 1.3126. Implementation period: 5–7 days.
Alternative scenario
The breakdown and the consolidation of the price below the level of 1.2802 will let the pair go down to the level of 1.2667.


No comments:
Write comments