
McDonald’s Corp.: wave analysis
15 May 2018, 09:36
| Scenario | |
|---|---|
| Timeframe | Weekly |
| Recommendation | SELL |
| Entry Point | 164.67 |
| Take Profit | 157.40, 154.90 |
| Stop Loss | 167.17 |
| Key Levels | 154.90, 157.40, 167.17, 178.80 |
| Alternative scenario | |
|---|---|
| Recommendation | BUY STOP |
| Entry Point | 167.20 |
| Take Profit | 178.80 |
| Stop Loss | 163.35 |
| Key Levels | 154.90, 157.40, 167.17, 178.80 |
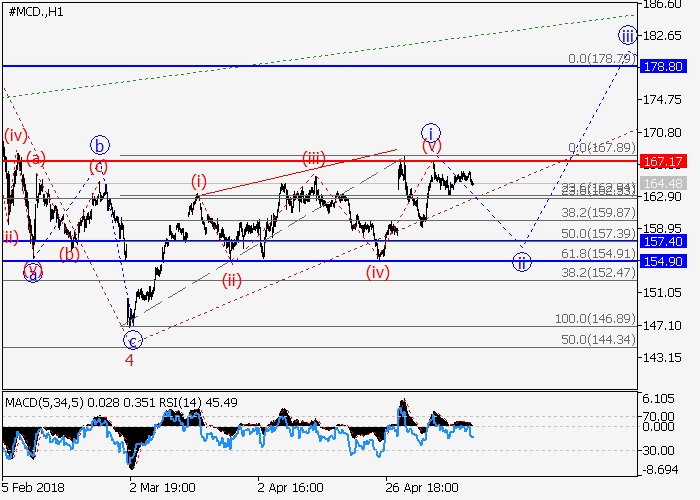
The price can fall within the correction.
On the 4-hour chart, the development of the downward correction as a fourth wave 4 of the higher level has ended. Locally the formation of the fifth wave has begun, within which the development of the first wave of the lower level i of 5 as a wedge has ended. If the assumption is correct, the price will fall within the wave ii of 5 to the levels of 157.40–154.90. The level of 167.17 is critical and stop-loss for this scenario.
Main scenario
Short positions will become relevant below the level of 167.17 with the targets at 157.40–154.90. Implementation period: 5–7 days.
Alternative scenario
The breakout and the consolidation of the price above the level of 167.17 will let the price grow to the level of 178.80.
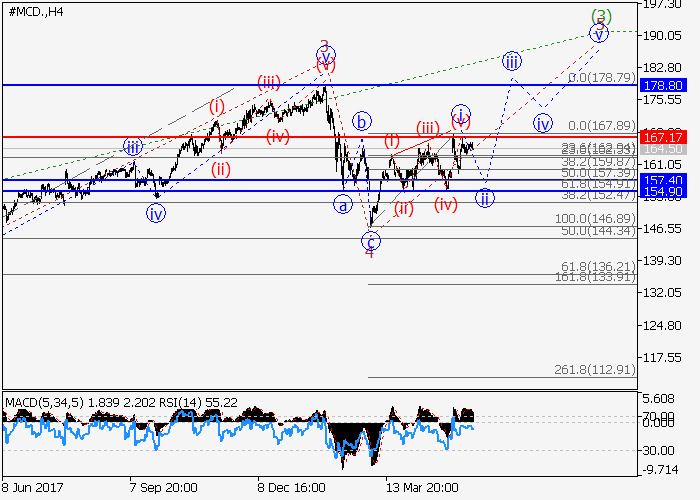


No comments:
Write comments