Intel Corp.: wave analysis
18 May 2018, 09:39
| Scenario | |
|---|---|
| Timeframe | Weekly |
| Recommendation | BUY |
| Entry Point | 54.81 |
| Take Profit | 59.00 |
| Stop Loss | 51.14 |
| Key Levels | 47.13, 51.14, 59.00 |
| Alternative scenario | |
|---|---|
| Recommendation | SELL STOP |
| Entry Point | 51.05 |
| Take Profit | 47.13 |
| Stop Loss | 52.50 |
| Key Levels | 47.13, 51.14, 59.00 |
The trend is upward.
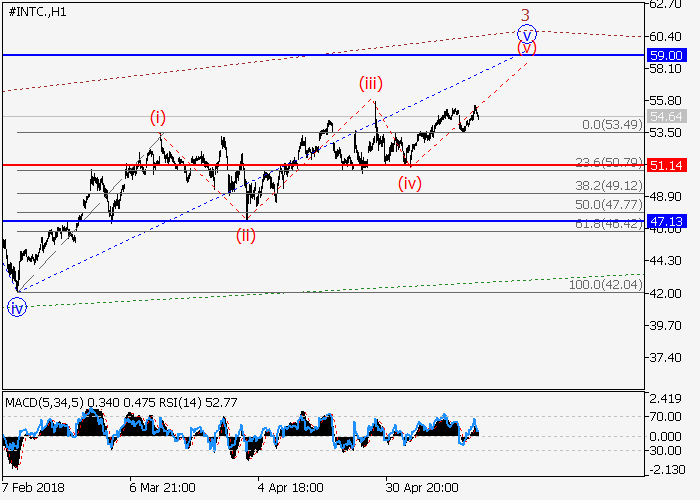
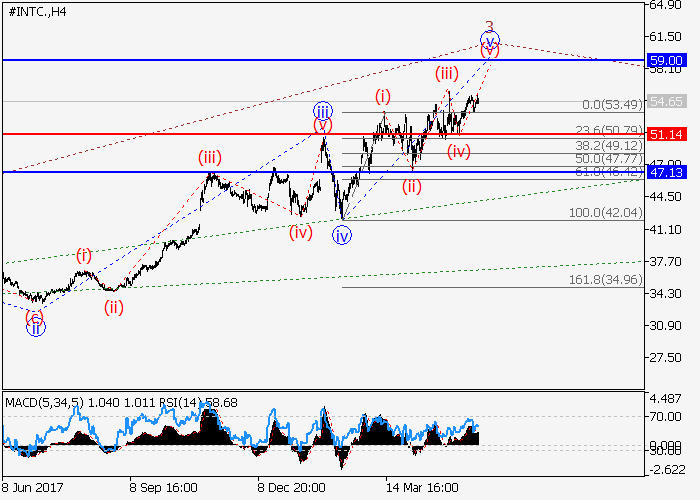
Within the H4 timeframe, the formation of an upward trend in the third wave 3 of the higher level is supposedly continuing. Locally, apparently, the fifth wave v of 3 is developing, within the framework of which the fifth wave of the lower level (v) of v is being formed. If the assumption is correct, the price will continue growing to the level of 59.00. The level of 51.14 is critical and stop-loss for this scenario.


Main scenario
Long positions are relevant from the corrections above the level of 51.14 with target at 59.00. Implementation period: 5–7 days.
Alternative scenario
Breakdown and consolidation of the price below the level of 51.14 will help the asset to continue declining to the level of 47.13.
Within the H4 timeframe, the formation of an upward trend in the third wave 3 of the higher level is supposedly continuing. Locally, apparently, the fifth wave v of 3 is developing, within the framework of which the fifth wave of the lower level (v) of v is being formed. If the assumption is correct, the price will continue growing to the level of 59.00. The level of 51.14 is critical and stop-loss for this scenario.


Main scenario
Long positions are relevant from the corrections above the level of 51.14 with target at 59.00. Implementation period: 5–7 days.
Alternative scenario
Breakdown and consolidation of the price below the level of 51.14 will help the asset to continue declining to the level of 47.13.


No comments:
Write comments