
Bitcoin: technical analysis
07 May 2018, 11:36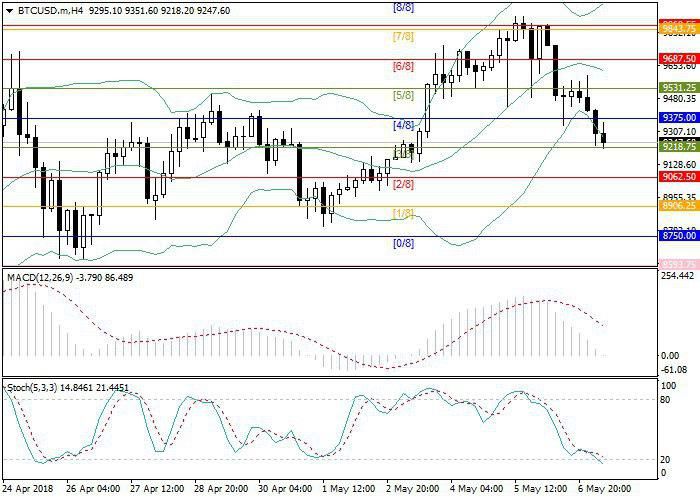
| Scenario | |
|---|---|
| Timeframe | Intraday |
| Recommendation | SELL STOP |
| Entry Point | 9200.00 |
| Take Profit | 9062.50, 8750.00 |
| Stop Loss | 9350.00 |
| Key Levels | 8906.25, 9062.50, 9218.75, 9375.00, 9531.25, 9687.50 |
| Alternative scenario | |
|---|---|
| Recommendation | BUY STOP |
| Entry Point | 9700.00 |
| Take Profit | 9843.75, 10000.00 |
| Stop Loss | 9600.00 |
| Key Levels | 8906.25, 9062.50, 9218.75, 9375.00, 9531.25, 9687.50 |
Current trend
Bitcoin is falling along the lower border of Bollinger Bands. The price is now testing the support level of 9218.75 (Murray [3/8]), the breakout of which will let the sellers decrease the price to the levels of 9062.50 (Murray [2/8])–8906.25 (Murray [1/8]).
The upward trend will restore after the price is set above the middle line of Bollinger Bands 9687.50 (Murray [6/8]). In this case, the instrument can grow to the area of 9843.75 (Murray [7/8])–10000.00 (Murray [8/8]).
Technical indicators reflect the further weakening of the instrument. Bollinger Bands are diverging, reflecting an active development of the current downward trend. MACD volumes are actively decreasing in the positive zone, forming a sell signal. Stochastic lines are pointed downwards; the indicator has entered the oversold area.
Support and resistance
Resistance levels: 9375.00, 9531.25, 9687.50.
Support levels: 9218.75, 9062.50, 8906.25.
Trading tips
Short positions can be opened below the level of 9218.75 with the targets at around 9062.50–8750.00 and stop loss 9350.00.
Long positions can be opened above the level of 9687.50 with the targets at around 9843.75–10000.00 and stop loss 9600.00.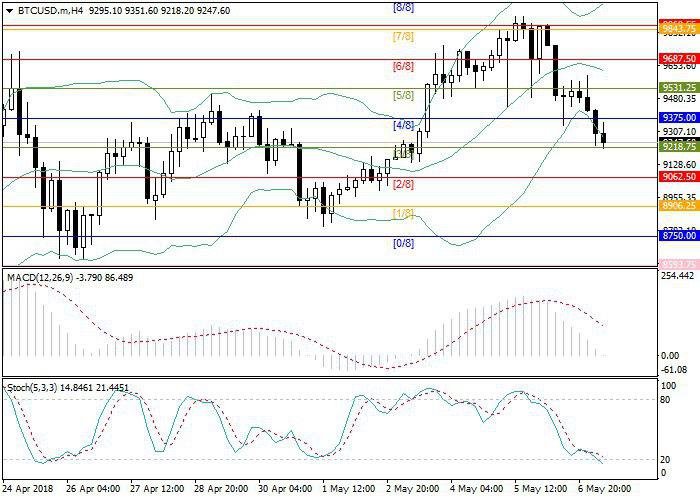


No comments:
Write comments