
AUD/USD: the instrument is correcting
23 May 2018, 09:26
| Scenario | |
|---|---|
| Timeframe | Intraday |
| Recommendation | BUY STOP |
| Entry Point | 0.7590 |
| Take Profit | 0.7650, 0.7667 |
| Stop Loss | 0.7540 |
| Key Levels | 0.7439, 0.7468, 0.7500, 0.7534, 0.7565, 0.7587, 0.7603, 0.7638 |
| Alternative scenario | |
|---|---|
| Recommendation | SELL STOP |
| Entry Point | 0.7530 |
| Take Profit | 0.7468, 0.7439, 0.7400 |
| Stop Loss | 0.7570 |
| Key Levels | 0.7439, 0.7468, 0.7500, 0.7534, 0.7565, 0.7587, 0.7603, 0.7638 |
Current trend
AUD showed growth against USD on Tuesday, updating the local maximum since April 25. However, the instrument failed to gain a foothold at this position, and before the afternoon session closed the "bears" had come into play.
With the publication of macroeconomic statistics from Australia on Wednesday, the fall of the instrument intensified. The Construction Work Done indicator in Q1 2018 rose by 0.2% QoQ only, with the forecast of +1.0% QoQ. Westpac Leading Index grew by 0.2% MoM in April, which was better than March data (–0.1% MoM) but a bit worse than optimistic forecasts of the experts.
On Wednesday, the investors will also focus on the speech by the head of the RBA, Philip Lowe, who will give a new assessment of the economic prospects in the country.
Support and resistance
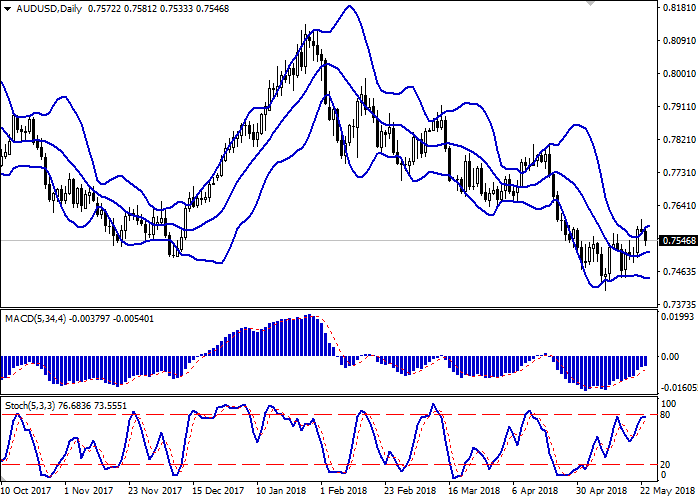
Bollinger Bands in D1 chart demonstrate flat dynamics. The price range is slightly widening from above, but is also prone to lateral dynamics, reflecting a change in the direction of trading in the short term.
MACD indicator is growing keeping a moderate buy signal (the histogram is above the signal line).
Stochastic, having approached the "80" mark reversed to the horizontal plane reacting to the appearance of "bearish" trend.
It is worth looking into the possibility of corrective decline in the short and/or ultra-short term.
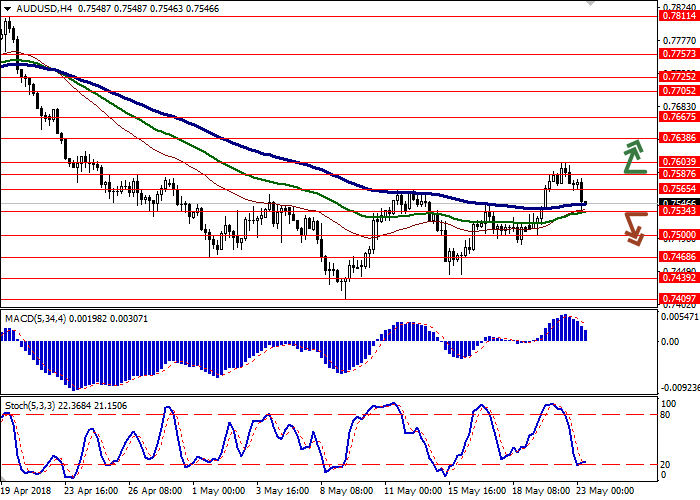
Resistance levels: 0.7565, 0.7587, 0.7603, 0.7638.
Support levels: 0.7534, 0.7500, 0.7468, 0.7439.
Trading tips
To open long positions one can rely on the breakout of the level of 0.7587, if the "bullish" signals from technical indicators resume. Take-profit – 0.7650–0.7667. Stop-loss — 0.7540.
A breakdown of the level of 0.7534 may be a signal to correctional sales with targets at 0.7468 or 0.7439, 0.7400 marks. Stop-loss — 0.7570.
Implementation period: 2-3 days.
AUD showed growth against USD on Tuesday, updating the local maximum since April 25. However, the instrument failed to gain a foothold at this position, and before the afternoon session closed the "bears" had come into play.
With the publication of macroeconomic statistics from Australia on Wednesday, the fall of the instrument intensified. The Construction Work Done indicator in Q1 2018 rose by 0.2% QoQ only, with the forecast of +1.0% QoQ. Westpac Leading Index grew by 0.2% MoM in April, which was better than March data (–0.1% MoM) but a bit worse than optimistic forecasts of the experts.
On Wednesday, the investors will also focus on the speech by the head of the RBA, Philip Lowe, who will give a new assessment of the economic prospects in the country.
Support and resistance
Bollinger Bands in D1 chart demonstrate flat dynamics. The price range is slightly widening from above, but is also prone to lateral dynamics, reflecting a change in the direction of trading in the short term.
MACD indicator is growing keeping a moderate buy signal (the histogram is above the signal line).
Stochastic, having approached the "80" mark reversed to the horizontal plane reacting to the appearance of "bearish" trend.
It is worth looking into the possibility of corrective decline in the short and/or ultra-short term.
Resistance levels: 0.7565, 0.7587, 0.7603, 0.7638.
Support levels: 0.7534, 0.7500, 0.7468, 0.7439.
Trading tips
To open long positions one can rely on the breakout of the level of 0.7587, if the "bullish" signals from technical indicators resume. Take-profit – 0.7650–0.7667. Stop-loss — 0.7540.
A breakdown of the level of 0.7534 may be a signal to correctional sales with targets at 0.7468 or 0.7439, 0.7400 marks. Stop-loss — 0.7570.
Implementation period: 2-3 days.


No comments:
Write comments