
AUD/USD: Australian dollar is going down
15 May 2018, 09:29
| Scenario | |
|---|---|
| Timeframe | Intraday |
| Recommendation | BUY STOP |
| Entry Point | 0.7540 |
| Take Profit | 0.7587, 0.7610, 0.7630 |
| Stop Loss | 0.7490 |
| Key Levels | 0.7409, 0.7439, 0.7468, 0.7500, 0.7534, 0.7565, 0.7587, 0.7612 |
| Alternative scenario | |
|---|---|
| Recommendation | SELL STOP |
| Entry Point | 0.7490 |
| Take Profit | 0.7439, 0.7400 |
| Stop Loss | 0.7540 |
| Key Levels | 0.7409, 0.7439, 0.7468, 0.7500, 0.7534, 0.7565, 0.7587, 0.7612 |
Current trend
AUD showed a decline against USD on Monday, departing from local highs since April 30. The fall of the instrument was facilitated by previous technical factors, while investors expected the appearance of new drivers in the market.
Negative dynamics can be traced today. The reason for the sales is the rather cautious minutes of the RBA meeting and the deputy head of the Bank, Guy Debelle’s, comments. The regulator signaled that it saw no arguments in favor of short-term growth in interest rate. Inflationary pressures continue to grow at a very slow pace, which, coupled with a moderate increase in salaries, shifts the time frame for possible tightening of monetary policy. Debelle noted the AUD depreciation positively, saying that he will continue to closely monitor the development of the situation.
Support and resistance
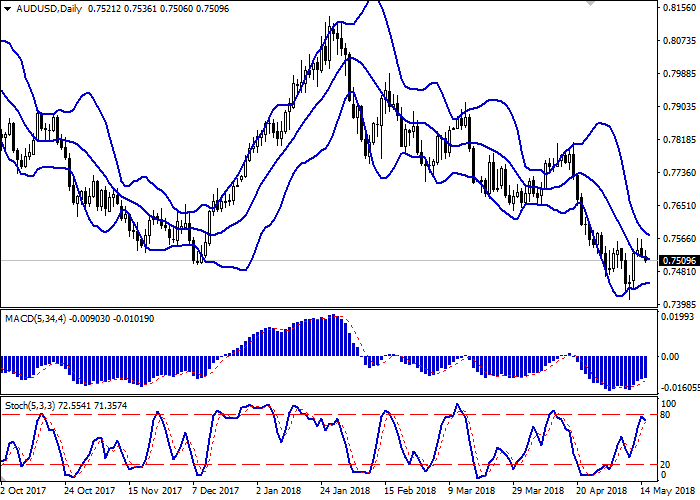
On the D1 chart Bollinger Bands are reversing horizontally. The price range is narrowing, reflecting the flat dynamics of trading in the short term.
MACD indicator is growing preserving a weak buy signal (the histogram is above the signal line).
Stochastic, having rebounded from the mark "80" reversed downwards, indicating the risks of development of corrective sales in the short and/or ultra-short term.
The technical indicators remain contradictory; therefore, to open new positions, it is necessary to wait for clarification of the situation.
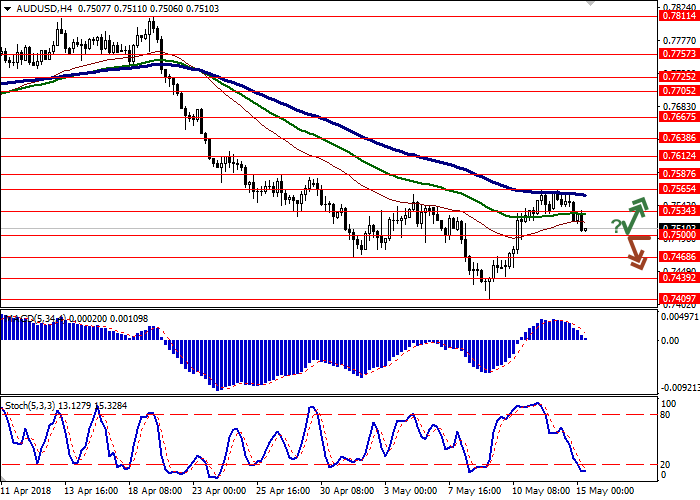
Resistance levels: 0.7534, 0.7565, 0.7587, 0.7612.
Support levels: 0.7500, 0.7468, 0.7439, 0.7409.
Trading tips
To open long positions, one can rely on the rebound from the support level of 0.7500, with the subsequent breakout of the 0.7534 mark. Take-profit — 0.7587 or 0.7610, 0.7630. Stop-loss — 0.7490. Implementation period: 2-3 days.
The breakdown of 0.7500 mark may serve as a signal to further sales with the targets at 0.7439, 0.7400. Stop-loss — 0.7540. Implementation period: 2-3 days.
AUD showed a decline against USD on Monday, departing from local highs since April 30. The fall of the instrument was facilitated by previous technical factors, while investors expected the appearance of new drivers in the market.
Negative dynamics can be traced today. The reason for the sales is the rather cautious minutes of the RBA meeting and the deputy head of the Bank, Guy Debelle’s, comments. The regulator signaled that it saw no arguments in favor of short-term growth in interest rate. Inflationary pressures continue to grow at a very slow pace, which, coupled with a moderate increase in salaries, shifts the time frame for possible tightening of monetary policy. Debelle noted the AUD depreciation positively, saying that he will continue to closely monitor the development of the situation.
Support and resistance
On the D1 chart Bollinger Bands are reversing horizontally. The price range is narrowing, reflecting the flat dynamics of trading in the short term.
MACD indicator is growing preserving a weak buy signal (the histogram is above the signal line).
Stochastic, having rebounded from the mark "80" reversed downwards, indicating the risks of development of corrective sales in the short and/or ultra-short term.
The technical indicators remain contradictory; therefore, to open new positions, it is necessary to wait for clarification of the situation.
Resistance levels: 0.7534, 0.7565, 0.7587, 0.7612.
Support levels: 0.7500, 0.7468, 0.7439, 0.7409.
Trading tips
To open long positions, one can rely on the rebound from the support level of 0.7500, with the subsequent breakout of the 0.7534 mark. Take-profit — 0.7587 or 0.7610, 0.7630. Stop-loss — 0.7490. Implementation period: 2-3 days.
The breakdown of 0.7500 mark may serve as a signal to further sales with the targets at 0.7439, 0.7400. Stop-loss — 0.7540. Implementation period: 2-3 days.


No comments:
Write comments