
Apple Inc.: wave analysis
24 May 2018, 09:46
| Scenario | |
|---|---|
| Timeframe | Weekly |
| Recommendation | BUY |
| Entry Point | 188.38 |
| Take Profit | 200.00, 205.00 |
| Stop Loss | 184.06 |
| Key Levels | 171.71, 175.28, 184.06, 200.00, 205.00 |
| Alternative scenario | |
|---|---|
| Recommendation | SELL STOP |
| Entry Point | 184.00 |
| Take Profit | 175.28, 171.71 |
| Stop Loss | 186.90 |
| Key Levels | 171.71, 175.28, 184.06, 200.00, 205.00 |
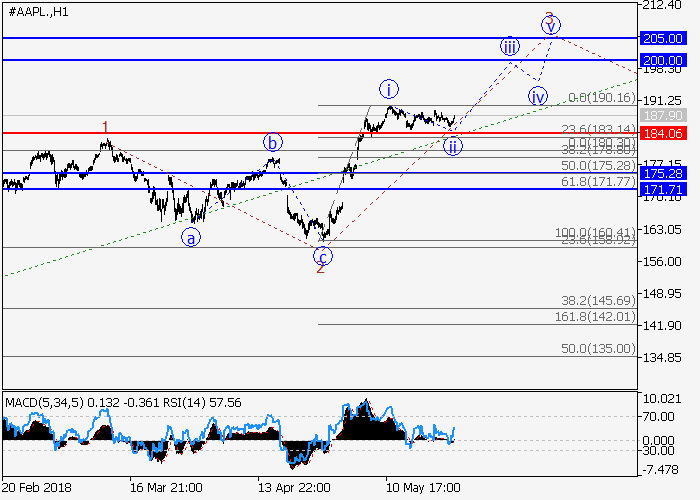
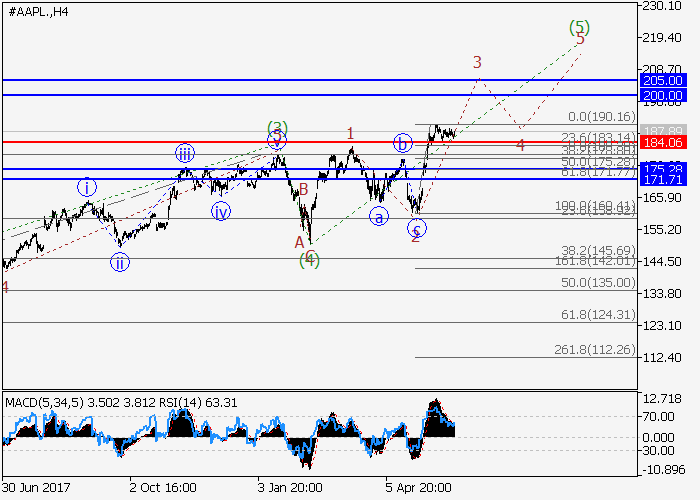
The trend is upward.
On the 4-hour chart, the fifth wave (5) of the higher level is developing. Now the wave 3 of (5) is developing, within which the local correction ii of 3 has ended. If the assumption is correct, the price will grow to the area of 200.00–205.00. The level of 184.06 is critical and stop-loss for this scenario.
Main scenario
Long positions will become relevant during the correction, above the level of 184.06 with the targets at 200.00–205.00. Implementation period: 5–7 days.
Alternative scenario
The breakdown and the consolidation of the price below the level of 184.06 will let the price go down to the levels of 175.28–171.71.


No comments:
Write comments