
Visa Inc. (V/NYSE): general analysis
09 April 2018, 11:42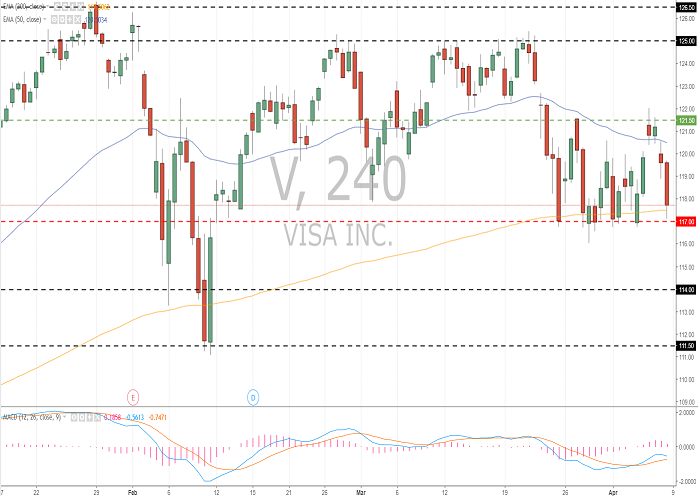
| Scenario | |
|---|---|
| Timeframe | Intraday |
| Recommendation | SELL STOP |
| Entry Point | 116.90 |
| Take Profit | 114.00, 111.50, 109.00 |
| Stop Loss | 120.00 |
| Key Levels | 111.50, 114.00, 117.00, 121.50 125.00 |
| Alternative scenario | |
|---|---|
| Recommendation | BUY STOP |
| Entry Point | 121.60 |
| Take Profit | 126.50, 129.00 |
| Stop Loss | 118.50 |
| Key Levels | 111.50, 114.00, 117.00, 121.50 125.00 |
Current trend
Visa reported Q2, 2018, financial report will be published on April 25, after the closing of the market. The Wall Street suggests 17.4% YoY growth of EPS to 1.01 USD. During the last six quarters, the company has been exceeding the market’s expectations.
Amazon.com Inc. is assessing potions of entering the digital payments market with its new payment system based on the voice assistant Alexa, which will compete the industry giants Visa, Mastercard and PayPal.
During the last week, Visa decreased by 1.61% against the growth of S&P 500 index by 0.68%.
Support and resistance
During the last two week, the trade is very active but mixed. The stocks are moving sideways. The key levels of support and resistance are 117.00 and 121.50 correspondingly. The indicators do not give a clear signal: the price consolidated between МА (50) and МА (200); MACD histogram has begun to decrease. It is better to open the positions from the key levels.
The comparative analysis of the indicators of the company and its competitors suggests the neutrality of its share prices.
Resistance levels: 121.50 125.00.
Support levels: 117.00, 114.00, 111.50.

Trading tips
Short positions can be opened after the price is set below the level of 117.00. The closing of the profitable positions is possible at the levels of 114.00, 111.50 and 109.00. Stop loss is 120.00.
Long positions can be opened after the price is set above the level of 121.50 with the targets at 126.50–129.00. Stop loss is 118.50.
Implementation period: 3 days.
Visa reported Q2, 2018, financial report will be published on April 25, after the closing of the market. The Wall Street suggests 17.4% YoY growth of EPS to 1.01 USD. During the last six quarters, the company has been exceeding the market’s expectations.
Amazon.com Inc. is assessing potions of entering the digital payments market with its new payment system based on the voice assistant Alexa, which will compete the industry giants Visa, Mastercard and PayPal.
During the last week, Visa decreased by 1.61% against the growth of S&P 500 index by 0.68%.
Support and resistance
During the last two week, the trade is very active but mixed. The stocks are moving sideways. The key levels of support and resistance are 117.00 and 121.50 correspondingly. The indicators do not give a clear signal: the price consolidated between МА (50) and МА (200); MACD histogram has begun to decrease. It is better to open the positions from the key levels.
The comparative analysis of the indicators of the company and its competitors suggests the neutrality of its share prices.
Resistance levels: 121.50 125.00.
Support levels: 117.00, 114.00, 111.50.
Trading tips
Short positions can be opened after the price is set below the level of 117.00. The closing of the profitable positions is possible at the levels of 114.00, 111.50 and 109.00. Stop loss is 120.00.
Long positions can be opened after the price is set above the level of 121.50 with the targets at 126.50–129.00. Stop loss is 118.50.
Implementation period: 3 days.


No comments:
Write comments