
USD/JPY: the pair is showing mixed dynamics
10 April 2018, 09:57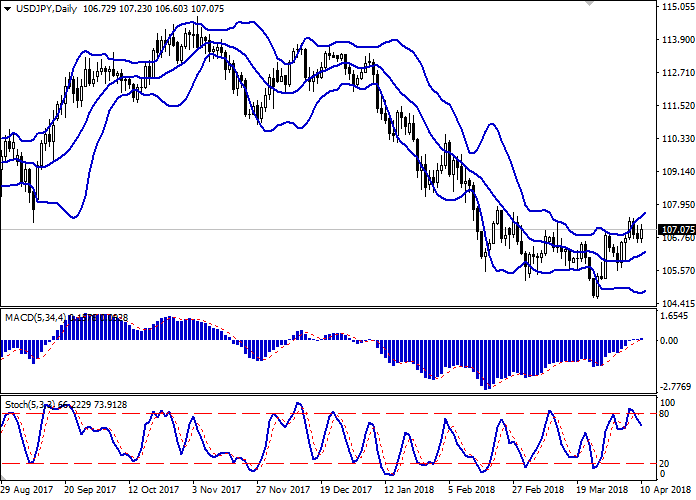
| Scenario | |
|---|---|
| Timeframe | Intraday |
| Recommendation | BUY STOP |
| Entry Point | 107.30 |
| Take Profit | 107.66, 107.80, 107.90 |
| Stop Loss | 106.80 |
| Key Levels | 105.88, 106.10, 106.44, 106.71, 107.00, 107.27, 107.47, 107.66 |
| Alternative scenario | |
|---|---|
| Recommendation | SELL STOP |
| Entry Point | 106.65 |
| Take Profit | 106.10, 106.00 |
| Stop Loss | 107.00 |
| Key Levels | 105.88, 106.10, 106.44, 106.71, 107.00, 107.27, 107.47, 107.66 |
Current trend
USD weakened against JPY on Monday, but today it has resumed growth. Macroeconomic statistics from Japan published yesterday did not provide any support to yen, while investors expect the emergence of new strong drivers in the market.
Japan's Consumer Confidence Index in March remained at the same level of 44.3 points with the forecast for growth to 44.9. In turn, the Eco Watchers Survey: Current in March rose from 48.6 to 48.9 points, which was better than the market expectations of 48.1. The Eco Watchers Survey: Outlook in March fell from 51.4 to 49.6 points, contrary to expectations of growth to 51.5.
Today, the traders focus on Japan's Machine Tool Orders for March, which is due at 08:00 (GMT+2). The US will be noted by the speech of the Fed's representative Robert Kaplan, and the publication of Producer Price Index for March at 14:30 (GMT+2).
Support and resistance
The Bollinger Bands in D1 chart show moderate growth. The price range expands slightly, freeing a path to new local highs for the "bulls".
MACD indicator is growing preserving a weak buy signal (histogram is above the signal line). The indicator is trying to gain a foothold above the zero mark.
Stochastic, having reversed downwards near its maximum marks indicates the development of corrective dynamics in the short or ultra-short term.
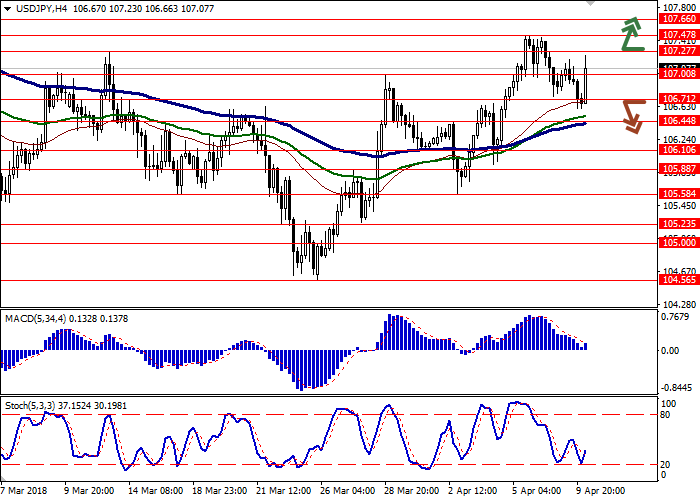
Resistance levels: 107.00, 107.27, 107.47, 107.66.
Support levels: 106.71, 106.44, 106.10, 105.88.

Trading tips
To open long positions, one can rely on the breakout of 107.27 mark. Take-profit — 107.66 or 107.80–107.90. Stop-loss – 106.80. Implementation period: 2-3 days.
The return of "bearish" trend with the breakdown of the level of 106.71 may become a signal for the return to the sales with targets at 106.10–106.00. Stop-loss – 107.00. Implementation period: 2-3 days.
USD weakened against JPY on Monday, but today it has resumed growth. Macroeconomic statistics from Japan published yesterday did not provide any support to yen, while investors expect the emergence of new strong drivers in the market.
Japan's Consumer Confidence Index in March remained at the same level of 44.3 points with the forecast for growth to 44.9. In turn, the Eco Watchers Survey: Current in March rose from 48.6 to 48.9 points, which was better than the market expectations of 48.1. The Eco Watchers Survey: Outlook in March fell from 51.4 to 49.6 points, contrary to expectations of growth to 51.5.
Today, the traders focus on Japan's Machine Tool Orders for March, which is due at 08:00 (GMT+2). The US will be noted by the speech of the Fed's representative Robert Kaplan, and the publication of Producer Price Index for March at 14:30 (GMT+2).
Support and resistance
The Bollinger Bands in D1 chart show moderate growth. The price range expands slightly, freeing a path to new local highs for the "bulls".
MACD indicator is growing preserving a weak buy signal (histogram is above the signal line). The indicator is trying to gain a foothold above the zero mark.
Stochastic, having reversed downwards near its maximum marks indicates the development of corrective dynamics in the short or ultra-short term.
Resistance levels: 107.00, 107.27, 107.47, 107.66.
Support levels: 106.71, 106.44, 106.10, 105.88.
Trading tips
To open long positions, one can rely on the breakout of 107.27 mark. Take-profit — 107.66 or 107.80–107.90. Stop-loss – 106.80. Implementation period: 2-3 days.
The return of "bearish" trend with the breakdown of the level of 106.71 may become a signal for the return to the sales with targets at 106.10–106.00. Stop-loss – 107.00. Implementation period: 2-3 days.


No comments:
Write comments