
McDonald’s Corp.: wave analysis
10 April 2018, 09:38
| Scenario | |
|---|---|
| Timeframe | Weekly |
| Recommendation | BUY |
| Entry Point | 161.14 |
| Take Profit | 178.72 |
| Stop Loss | 155.30 |
| Key Levels | 144.34, 154.74, 178.72 |
| Alternative scenario | |
|---|---|
| Recommendation | SELL STOP |
| Entry Point | 154.70 |
| Take Profit | 144.34 |
| Stop Loss | 158.15 |
| Key Levels | 144.34, 154.74, 178.72 |
The price can grow.
On the 4-hour chart, the development of the downward correction within the fourth wave 4 of the higher level has ended. Locally the formation of the fifth wave, within which the first wave of the lower level i of 5 is forming, has begun. If the assumption is correct, the price will grow to the level of 178.72 and higher. The level of 154.74 is critical for this scenario.
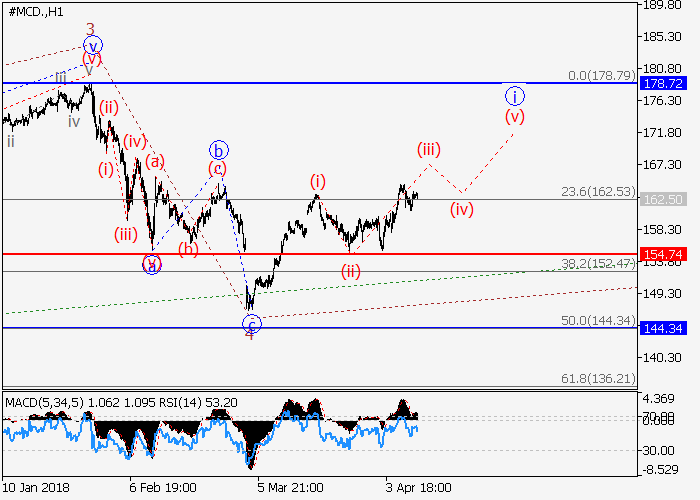
Main scenario
Long positions will become relevant during the correction, above the level of 154.74 with the target at 178.72.
Alternative scenario
The breakdown and the consolidation of the price below the level of 154.74 will let the price go down to the level of 144.34.
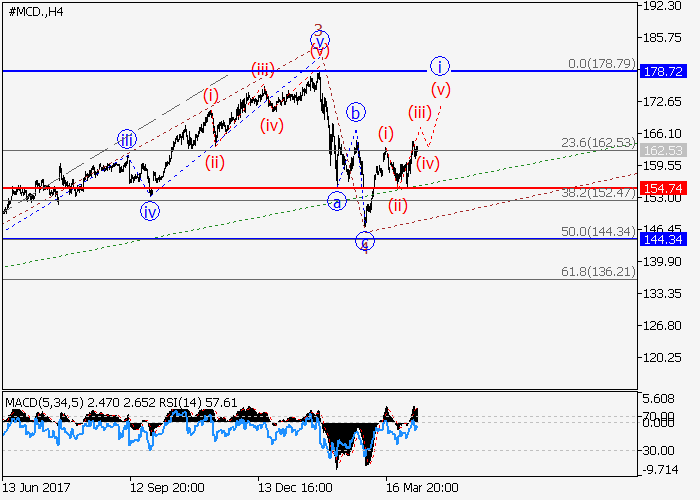
On the 4-hour chart, the development of the downward correction within the fourth wave 4 of the higher level has ended. Locally the formation of the fifth wave, within which the first wave of the lower level i of 5 is forming, has begun. If the assumption is correct, the price will grow to the level of 178.72 and higher. The level of 154.74 is critical for this scenario.
Main scenario
Long positions will become relevant during the correction, above the level of 154.74 with the target at 178.72.
Alternative scenario
The breakdown and the consolidation of the price below the level of 154.74 will let the price go down to the level of 144.34.


No comments:
Write comments