XAU/USD: gold is going down
18 September 2017, 09:57
| Scenario | |
|---|---|
| Timeframe | Intraday |
| Recommendation | BUY STOP |
| Entry Point | 1317.50 |
| Take Profit | 1343.98 |
| Stop Loss | 1300.44 |
| Key Levels | 1291.71, 1300.44, 1307.75, 1314.05, 1326.65, 1334.32, 1343.98, 1350.00 |
| Alternative scenario | |
|---|---|
| Recommendation | SELL STOP |
| Entry Point | 1312.00 |
| Take Profit | 1300.00 |
| Stop Loss | 1325.65 |
| Key Levels | 1291.71, 1300.44, 1307.75, 1314.05, 1326.65, 1334.32, 1343.98, 1350.00 |
Current trend
Gold prices have considerable dropped as a result of trading on Friday, September 15, having reacted to the statement of an ECB representative about the need to terminate the bank's stimulation program. On Monday, September 18, investors will focus attention on consumer inflation statistics from Eurozone that will be considered in view of possible QE program reduction in the near future. Later on the attention of market players will be switched to US statistics. The most interesting day of the week will be Wednesday, September 20, when the meetings of ECB and the Fed will take place.
Support and resistance
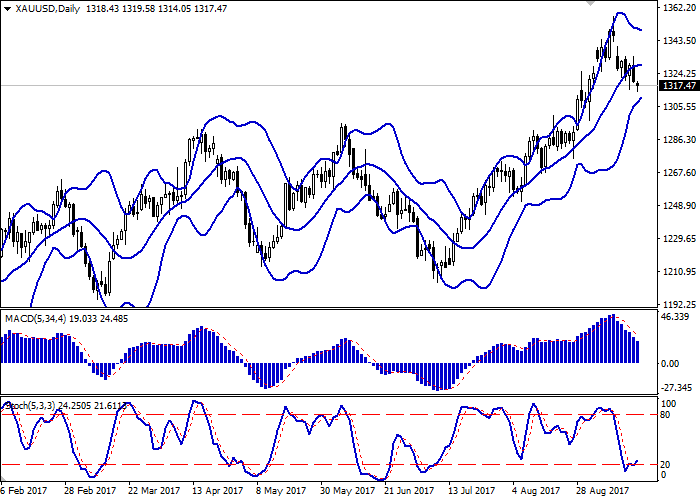
On the D1 chart Bollinger Bands have reversed horizontally. The price range is narrowing. MACD is going down preserving a stable sell signal (being located under the signal line). Stochastic is trying to reverse upwards and is located close to the border with the oversold area.
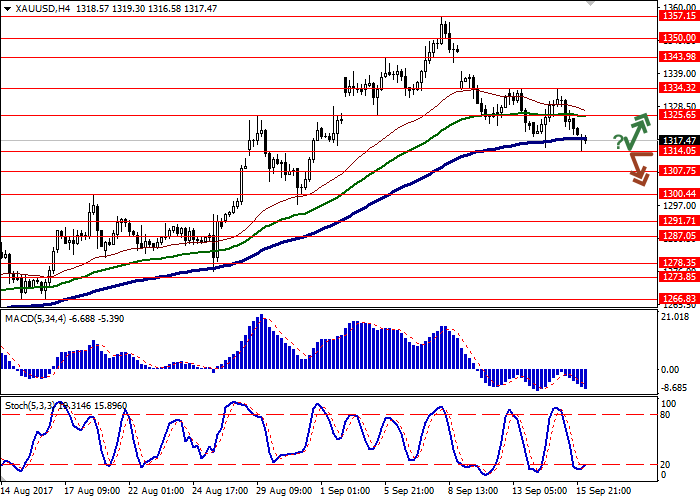
Resistance levels: 1326.65, 1334.32, 1343.98, 1350.00.
Support levels: 1314.05, 1307.75, 1300.44, 1291.71.


Trading tips
Long positions may be opened after the reversal of the instrument near current price levels with target at 1343.98 and stop-loss at 1300.44. The period of implementation is 2-3 days.
A breakdown of the level of 1314.05 may be a signal for further sales with target at 1300.00 and stop-loss at 1325.65. The period of implementation is 2-3 days.
Gold prices have considerable dropped as a result of trading on Friday, September 15, having reacted to the statement of an ECB representative about the need to terminate the bank's stimulation program. On Monday, September 18, investors will focus attention on consumer inflation statistics from Eurozone that will be considered in view of possible QE program reduction in the near future. Later on the attention of market players will be switched to US statistics. The most interesting day of the week will be Wednesday, September 20, when the meetings of ECB and the Fed will take place.
Support and resistance
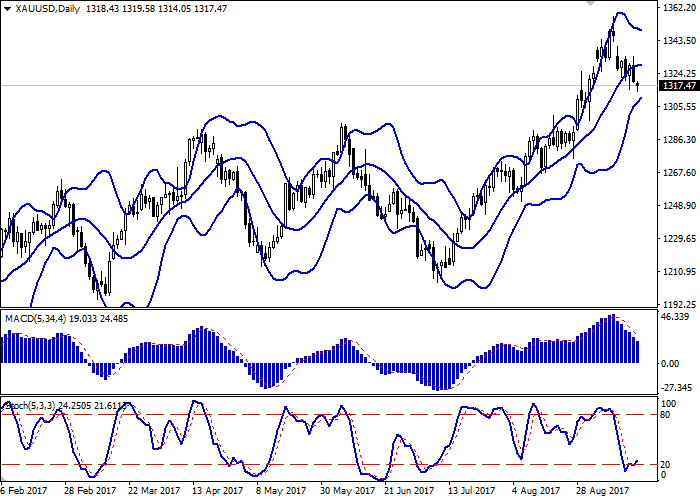
On the D1 chart Bollinger Bands have reversed horizontally. The price range is narrowing. MACD is going down preserving a stable sell signal (being located under the signal line). Stochastic is trying to reverse upwards and is located close to the border with the oversold area.
Resistance levels: 1326.65, 1334.32, 1343.98, 1350.00.
Support levels: 1314.05, 1307.75, 1300.44, 1291.71.


Trading tips
Long positions may be opened after the reversal of the instrument near current price levels with target at 1343.98 and stop-loss at 1300.44. The period of implementation is 2-3 days.
A breakdown of the level of 1314.05 may be a signal for further sales with target at 1300.00 and stop-loss at 1325.65. The period of implementation is 2-3 days.


No comments:
Write comments