
WTI Crude Oil: general review
20 September 2017, 13:25
| Scenario | |
|---|---|
| Timeframe | Intraday |
| Recommendation | BUY STOP |
| Entry Point | 50.55 |
| Take Profit | 51.40, 51.85 |
| Stop Loss | 49.95 |
| Key Levels | 48.50, 49.10, 49.65, 50.00, 50.50, 51.20, 51.95, 52.45 |
| Alternative scenario | |
|---|---|
| Recommendation | SELL STOP |
| Entry Point | 49.90 |
| Take Profit | 49.15, 48.80 |
| Stop Loss | 50.20 |
| Key Levels | 48.50, 49.10, 49.65, 50.00, 50.50, 51.20, 51.95, 52.45 |
Current trend
Yesterday in the second half of the day the price of WTI oil dropped below $50 per barrel in view of release of strong data on the US housing market. However in just several hours the trading instrument regained a number of positions after the release of the weekly API report on oil stocks that showed the increase by 1.4 mln barrels a week while specialists expected higher growth by 3.5 mln barrels. Moreover, yesterday the head of Iraqi Oil Ministry Jabbar al-Luaibi pointed out that OPEC was discussion the possibility of extension of the global oil pact and even bigger reduction of oil production.
While the US oil industry was restoring after storm, one more hurricane formed over the Atlantic Ocean. The new storm named Maria already has the 5th (maximum) category and drilling rigs in the Gulf of Mexico are under threat once again. If Maria influences the US oil infrastructure, oil will receive a strong push for further growth.
Today market players are cautious in view of the upcoming Fed's decision on the monetary policy and the release of a report by the US Department of Energy on weekly changes in commercial stocks. Tomorrow attention should be paid to the results of the monitoring meeting in OPEC+ format.
Support and resistance
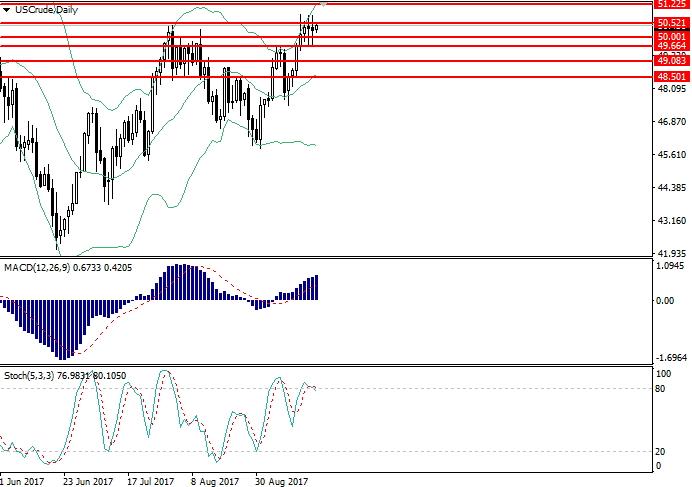
On D1 chart the instrument is trying to consolidate above the level of 50.50. Bollinger Bands are directed upwards, and the price range is widening indicating the preservation of the current trend. MACD histogram is in positive zone, keeping a strong signal for the opening of long positions. Stochastic has left the overbought area forming the sell signal.
Support levels: 48.50, 49.10, 49.65, 50.00.
Resistance levels: 50.50, 51.20, 51.95, 52.45.
Trading tips
Long positions may be opened from the level of 50.55 with targets at 51.40, 51.85 and stop-loss at 49.95. The period of implementation is 1-2 days.
Short positions may be opened from the level of 49.90 with targets at 49.15, 48.80 and stop-loss at 50.20. The period of implementation is 1-3 days.
Yesterday in the second half of the day the price of WTI oil dropped below $50 per barrel in view of release of strong data on the US housing market. However in just several hours the trading instrument regained a number of positions after the release of the weekly API report on oil stocks that showed the increase by 1.4 mln barrels a week while specialists expected higher growth by 3.5 mln barrels. Moreover, yesterday the head of Iraqi Oil Ministry Jabbar al-Luaibi pointed out that OPEC was discussion the possibility of extension of the global oil pact and even bigger reduction of oil production.
While the US oil industry was restoring after storm, one more hurricane formed over the Atlantic Ocean. The new storm named Maria already has the 5th (maximum) category and drilling rigs in the Gulf of Mexico are under threat once again. If Maria influences the US oil infrastructure, oil will receive a strong push for further growth.
Today market players are cautious in view of the upcoming Fed's decision on the monetary policy and the release of a report by the US Department of Energy on weekly changes in commercial stocks. Tomorrow attention should be paid to the results of the monitoring meeting in OPEC+ format.
Support and resistance
On D1 chart the instrument is trying to consolidate above the level of 50.50. Bollinger Bands are directed upwards, and the price range is widening indicating the preservation of the current trend. MACD histogram is in positive zone, keeping a strong signal for the opening of long positions. Stochastic has left the overbought area forming the sell signal.
Support levels: 48.50, 49.10, 49.65, 50.00.
Resistance levels: 50.50, 51.20, 51.95, 52.45.
Trading tips
Long positions may be opened from the level of 50.55 with targets at 51.40, 51.85 and stop-loss at 49.95. The period of implementation is 1-2 days.
Short positions may be opened from the level of 49.90 with targets at 49.15, 48.80 and stop-loss at 50.20. The period of implementation is 1-3 days.


No comments:
Write comments