
USD/JPY: wave analysis
08 September 2017, 08:50
| Scenario | |
|---|---|
| Timeframe | Intraday |
| Recommendation | SELL |
| Entry Point | 107.75 |
| Take Profit | 106.45 |
| Stop Loss | 108.35 |
| Key Levels | 106.45, 109.37, 110.70 |
| Alternative scenario | |
|---|---|
| Recommendation | BUY STOP |
| Entry Point | 109.40 |
| Take Profit | 110.70 |
| Stop Loss | 108.80 |
| Key Levels | 106.45, 109.37, 110.70 |
The trend is downward.
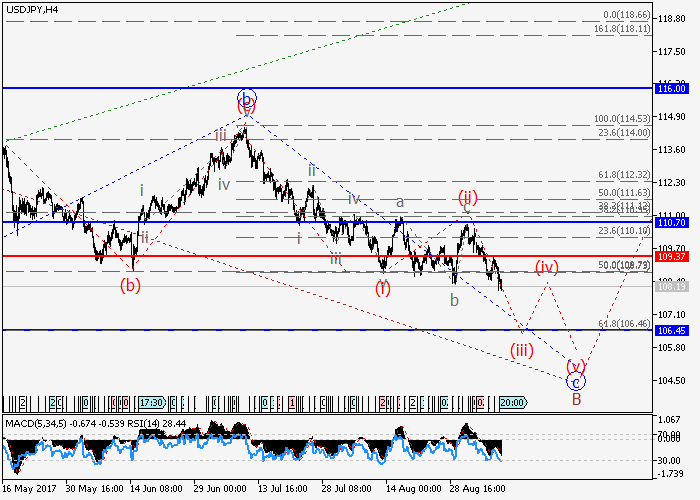
The wave c of В of the higher level is forming. At the moment the third wave (iii) of c, within which the third wave of the lower level iii of (iii) is developing, is forming. If the assumption is correct, the pair will fall to the level of 106.45. The level of 109.37 is critical for this scenario.
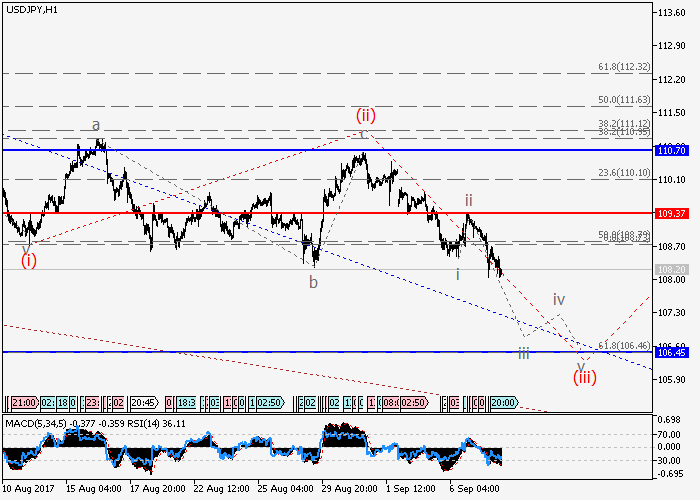
Main scenario
Short positions can be opened during the correction, below the level of 109.37 with the target at 106.45.
Alternative scenario
The breakout and the consolidation of the price above the level of 109.37 will let the pair grow to the level of 110.70.
The wave c of В of the higher level is forming. At the moment the third wave (iii) of c, within which the third wave of the lower level iii of (iii) is developing, is forming. If the assumption is correct, the pair will fall to the level of 106.45. The level of 109.37 is critical for this scenario.
Main scenario
Short positions can be opened during the correction, below the level of 109.37 with the target at 106.45.
Alternative scenario
The breakout and the consolidation of the price above the level of 109.37 will let the pair grow to the level of 110.70.


No comments:
Write comments