
USD/JPY: calmness in North Korea caused the growth of the pair
12 September 2017, 13:09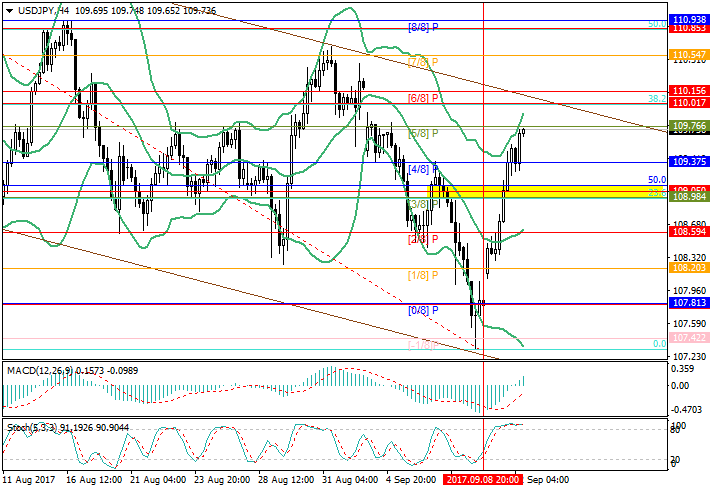
| Scenario | |
|---|---|
| Timeframe | Intraday |
| Recommendation | BUY |
| Entry Point | 109.75 |
| Take Profit | 110.00, 110.55, 110.85 |
| Stop Loss | 109.40 |
| Key Levels | 107.80, 108.20, 108.60, 109.00, 110.00, 110.55, 110.85 |
| Alternative scenario | |
|---|---|
| Recommendation | SELL STOP |
| Entry Point | 108.90 |
| Take Profit | 108.60, 108.20, 107.80 |
| Stop Loss | 109.40 |
| Key Levels | 107.80, 108.20, 108.60, 109.00, 110.00, 110.55, 110.85 |
Current trend
The pair started the week with considerable growth connected with the release of tension in the Korean Peninsula.
Investors waited for new missile tests on September 9, but Pyohgyang refused from provocative actions. On the other hand, on Monday the UN Security Council imposed a number of new sanctions on North Korea except for the most notable embargo on oil supply. This was also considered a positive action by the market. As a result, risk appetites returned to the market and by now let the pair reach the level of 109.70. Recent data on machine building orders (the volume of which reduced by 7.5% YoY in July) also put pressure on yen.
Support and resistance
Technically the pair has increased above the gathering of Fibo correction at 109.00 and is aiming at 110.00 (Fibo correction 38.2%, Murrey level [6/8]) to the area of the upper border of the downward channel. Breaking through this level will open a way for growth to 110.85 (Fibo correction 50.0%, Murrey level [8/8]). In case of reversal of the price around the level of 110.00 possible targets of the "bears" will be the levels of 109.00 (gathering of Fibo corrections), 108.60 (middle line of Bollinger Bands, Murrey level [2/8]) and 107.80 (Murrey level [0/8]). Technical indicators generally show growth but do not exclude the beginning of correction. Bollinger Bands are reversing upwards, and MACD histogram grows in the positive zone. Stochastic is in the overbought area but may leave it forming a sell signal.
Support levels: 109.00, 108.60, 108.20, 107.80.
Resistance levels: 110.00, 110.55, 110.85.

Trading tips
In the current situation long positions should be opened at the current price with targets at 110.00, 110.55, 110.85 and stop-loss at 109.40.
Short positions should be opened below the level of 109.00 or in case of reversal near 110.00 with targets at 108.60, 108.20, 107.80 and stop-loss at 109.40 and 110.40.
The pair started the week with considerable growth connected with the release of tension in the Korean Peninsula.
Investors waited for new missile tests on September 9, but Pyohgyang refused from provocative actions. On the other hand, on Monday the UN Security Council imposed a number of new sanctions on North Korea except for the most notable embargo on oil supply. This was also considered a positive action by the market. As a result, risk appetites returned to the market and by now let the pair reach the level of 109.70. Recent data on machine building orders (the volume of which reduced by 7.5% YoY in July) also put pressure on yen.
Support and resistance
Technically the pair has increased above the gathering of Fibo correction at 109.00 and is aiming at 110.00 (Fibo correction 38.2%, Murrey level [6/8]) to the area of the upper border of the downward channel. Breaking through this level will open a way for growth to 110.85 (Fibo correction 50.0%, Murrey level [8/8]). In case of reversal of the price around the level of 110.00 possible targets of the "bears" will be the levels of 109.00 (gathering of Fibo corrections), 108.60 (middle line of Bollinger Bands, Murrey level [2/8]) and 107.80 (Murrey level [0/8]). Technical indicators generally show growth but do not exclude the beginning of correction. Bollinger Bands are reversing upwards, and MACD histogram grows in the positive zone. Stochastic is in the overbought area but may leave it forming a sell signal.
Support levels: 109.00, 108.60, 108.20, 107.80.
Resistance levels: 110.00, 110.55, 110.85.
Trading tips
In the current situation long positions should be opened at the current price with targets at 110.00, 110.55, 110.85 and stop-loss at 109.40.
Short positions should be opened below the level of 109.00 or in case of reversal near 110.00 with targets at 108.60, 108.20, 107.80 and stop-loss at 109.40 and 110.40.


No comments:
Write comments