
AUD/USD: the pair is strengthening
20 September 2017, 09:34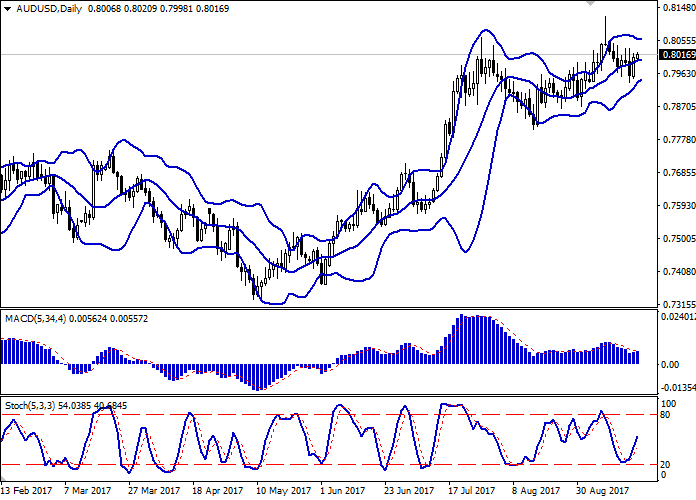
| Scenario | |
|---|---|
| Timeframe | Intraday |
| Recommendation | BUY STOP |
| Entry Point | 0.8050 |
| Take Profit | 0.8100, 0.8123 |
| Stop Loss | 0.8000 |
| Key Levels | 0.7917, 0.7954, 0.7978, 0.7994, 0.8020, 0.8042, 0.8064, 0.8080 |
| Alternative scenario | |
|---|---|
| Recommendation | SELL STOP |
| Entry Point | 0.7970 |
| Take Profit | 0.7920, 0.7900 |
| Stop Loss | 0.8020 |
| Key Levels | 0.7917, 0.7954, 0.7978, 0.7994, 0.8020, 0.8042, 0.8064, 0.8080 |
Current trend
Australian dollar grew as a result of trading on Tuesday, September 19, moving away from local minimums updated yesterday. The growth of the instrument was facilitated by neutral RBA minutes as well as waiting for the results of the Fed's meeting scheduled for Wednesday, September 20. Mixed data on the dynamics of construction in the USA in August had uncertain influence on the instrument.
During the morning session on September 20 the pair has been showing more moderate growth partially explained by weak data on leading indicators index from Australia. According to Westpac data, in August the index dropped by 0.1% MoM after growing by 0.1% MoM in July. The attention of the investors is focused on the release of the Fed's meeting minutes at 20:00 (GMT+2).
Support and resistance
On the D1 chart Bollinger Bands are gradually reversing horizontally. The price range is slightly narrowing in the lower part. MACD indicator is gradually reversing upwards trying to form a buy signal (the histogram has to consolidate above the signal line). Stochastic is showing more confident growth.
Resistance levels: 0.8020, 0.8042, 0.8064, 0.8080.
Support levels: 0.7994, 0.7978, 0.7954, 0.7917.
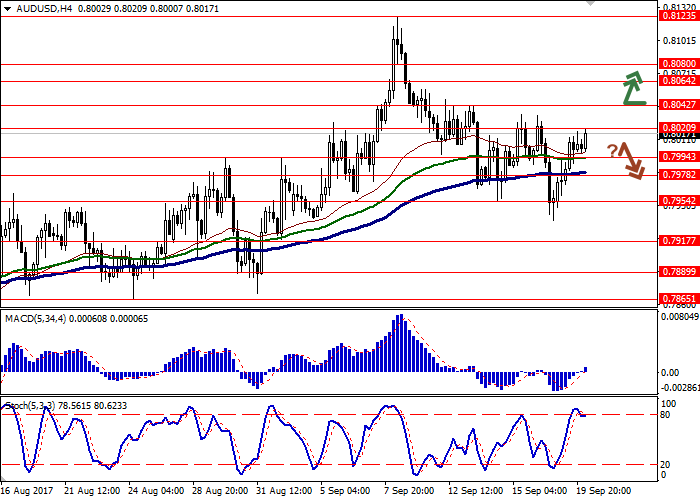

Trading tips
Long positions may be opened after breaking through the level of 0.8042 with targets at 0.8100, 0.8123 and stop-loss at 0.8000. The period of implementation is 2 days.
A reversal near the level of 0.8000 and further breakthrough of the level of 0.7978 may be a signal for sale with targets at 0.7920, 0.7900 and stop-loss at 0.8020. The period of implementation is 2 days.
Australian dollar grew as a result of trading on Tuesday, September 19, moving away from local minimums updated yesterday. The growth of the instrument was facilitated by neutral RBA minutes as well as waiting for the results of the Fed's meeting scheduled for Wednesday, September 20. Mixed data on the dynamics of construction in the USA in August had uncertain influence on the instrument.
During the morning session on September 20 the pair has been showing more moderate growth partially explained by weak data on leading indicators index from Australia. According to Westpac data, in August the index dropped by 0.1% MoM after growing by 0.1% MoM in July. The attention of the investors is focused on the release of the Fed's meeting minutes at 20:00 (GMT+2).
Support and resistance
On the D1 chart Bollinger Bands are gradually reversing horizontally. The price range is slightly narrowing in the lower part. MACD indicator is gradually reversing upwards trying to form a buy signal (the histogram has to consolidate above the signal line). Stochastic is showing more confident growth.
Resistance levels: 0.8020, 0.8042, 0.8064, 0.8080.
Support levels: 0.7994, 0.7978, 0.7954, 0.7917.
Trading tips
Long positions may be opened after breaking through the level of 0.8042 with targets at 0.8100, 0.8123 and stop-loss at 0.8000. The period of implementation is 2 days.
A reversal near the level of 0.8000 and further breakthrough of the level of 0.7978 may be a signal for sale with targets at 0.7920, 0.7900 and stop-loss at 0.8020. The period of implementation is 2 days.


No comments:
Write comments