
AUD/JPY: Ichimoku clouds
11 September 2017, 02:25| Scenario | |
|---|---|
| Timeframe | Weekly |
| Recommendation | BUY |
| Entry Point | 87.21 |
| Take Profit | 88.15 |
| Stop Loss | 86.71 |
| Key Levels | 86.55, 86.70, 87.20, 87.45, 87.70, 88.00, 88.15. |
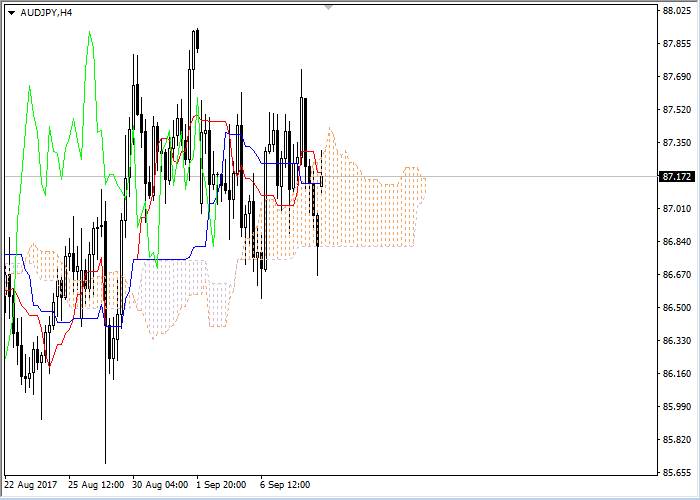
Let's look at the four-hour chart. Tenkan-sen line is above Kijun-sen, the lines are horizontal . Confirmative line Chikou Span is crossing the price chart from below, current cloud is ascending. The instrument is trading between Tenkan-sen and Kijun-sen lines. Kijun-sen and Tenkan-sen lines have become support (87.13) and resistance (87.20) levels respectively
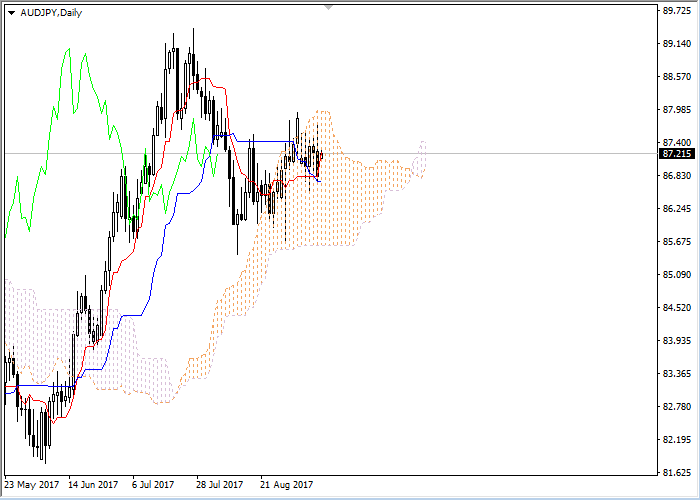
On the daily chart Tenkan-sen line is above Kijun-sen, the red line is directed upwards, while the blue one remains horizontal. Confirmative line Chikou Span is approaching the price chart from below, current cloud is going to reverse from descending to ascending. The instrument has been corrected to the Tenkan-sen line. The closest support level is the upper border of the cloud (86.94). The closest resistance level is Tenkan-sen line (87.22).
It is recommended to open long positions at current price with Take Profit at the level of previous maximum of Chikou Span (88.15) line and Stop Loss at the level of Kijun-sen line (86.71).


No comments:
Write comments