
NZD/USD: the pair is showing ambiguous dynamics
04 February 2019, 09:43
| Scenario | |
|---|---|
| Timeframe | Intraday |
| Recommendation | BUY STOP |
| Entry Point | 0.6930, 0.6945 |
| Take Profit | 0.7000 |
| Stop Loss | 0.6900, 0.6890 |
| Key Levels | 0.6789, 0.6814, 0.6847, 0.6871, 0.6923, 0.6940, 0.6968, 0.7000 |
| Alternative scenario | |
|---|---|
| Recommendation | SELL STOP |
| Entry Point | 0.6865 |
| Take Profit | 0.6814, 0.6789 |
| Stop Loss | 0.6900 |
| Key Levels | 0.6789, 0.6814, 0.6847, 0.6871, 0.6923, 0.6940, 0.6968, 0.7000 |
Current trend
NZD showed a decline on Friday, departing from the updated local high of December 4. The reason for the emergence of "bearish" trend was the publication of positive macroeconomic statistics from the US.
The pressure on USD continues to be exerted by the tense situation around the relations between China and the US, although there are positive moments here. Last week, another round of US-China trade negotiations in Washington ended. Both sides rated them as successful and constructive. The Xinhua Agency mentions that China has agreed to increase imports of agricultural, energy and industrial products from the US, as well as cooperate in the field of intellectual property protection. On Thursday, President Donald Trump announced that Finance Secretary, Steven Mnuchin, and Trade Representative, Robert Lighthizer, would go to China for a new round of talks in mid-February, and Trump could meet with Xi Jinping at the end of February. The market assesses the chances of concluding a deal as good.
Support and resistance
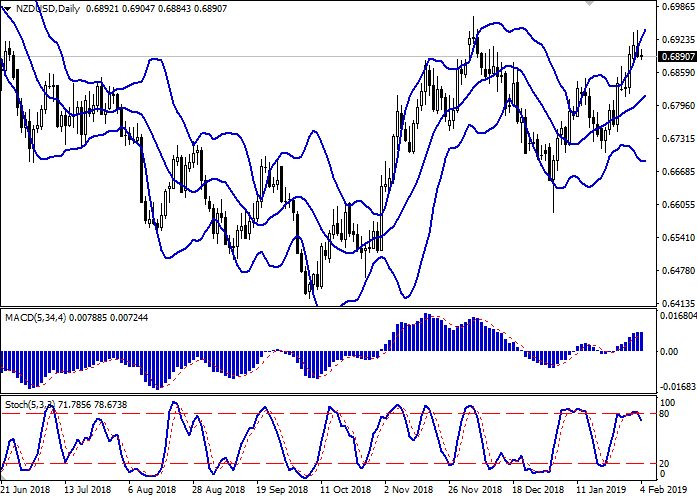
Bollinger Bands in D1 chart show stable growth. The price range expands from above, freeing a path to new local highs for the "bulls". MACD is gradually reversing downwards keeping a previous buy signal (located above the signal line). Stochastic demonstrates similar dynamics, reversing downwards at its maximum levels.
It is worth looking into the possibility of corrective decline in the short and/or ultra-short term.
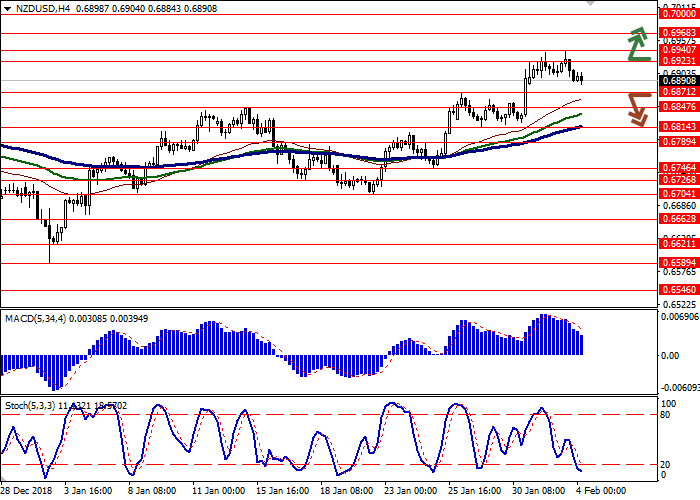
Resistance levels: 0.6923, 0.6940, 0.6968, 0.7000.
Trading tips
To open long positions, one can rely on the breakout of 0.6923 or 0.6940. Take profit — 0.7000. Stop loss — 0.6900 or 0.6890.
A breakdown of 0.6871 may be a signal to new sales with target at 0.6814 or 0.6789. Stop loss — 0.6900.
Implementation time: 2-3 days.
NZD showed a decline on Friday, departing from the updated local high of December 4. The reason for the emergence of "bearish" trend was the publication of positive macroeconomic statistics from the US.
The pressure on USD continues to be exerted by the tense situation around the relations between China and the US, although there are positive moments here. Last week, another round of US-China trade negotiations in Washington ended. Both sides rated them as successful and constructive. The Xinhua Agency mentions that China has agreed to increase imports of agricultural, energy and industrial products from the US, as well as cooperate in the field of intellectual property protection. On Thursday, President Donald Trump announced that Finance Secretary, Steven Mnuchin, and Trade Representative, Robert Lighthizer, would go to China for a new round of talks in mid-February, and Trump could meet with Xi Jinping at the end of February. The market assesses the chances of concluding a deal as good.
Support and resistance
Bollinger Bands in D1 chart show stable growth. The price range expands from above, freeing a path to new local highs for the "bulls". MACD is gradually reversing downwards keeping a previous buy signal (located above the signal line). Stochastic demonstrates similar dynamics, reversing downwards at its maximum levels.
It is worth looking into the possibility of corrective decline in the short and/or ultra-short term.
Resistance levels: 0.6923, 0.6940, 0.6968, 0.7000.
Trading tips
To open long positions, one can rely on the breakout of 0.6923 or 0.6940. Take profit — 0.7000. Stop loss — 0.6900 or 0.6890.
A breakdown of 0.6871 may be a signal to new sales with target at 0.6814 or 0.6789. Stop loss — 0.6900.
Implementation time: 2-3 days.


No comments:
Write comments