
Brent Crude Oil: oil prices are rising moderately
31 January 2019, 08:41| Scenario | |
|---|---|
| Timeframe | Intraday |
| Recommendation | BUY STOP |
| Entry Point | 62.35 |
| Take Profit | 63.82, 64.00 |
| Stop Loss | 61.50 |
| Key Levels | 59.44, 60.50, 61.00, 61.50, 62.30, 63.04, 63.82, 64.42 |
| Alternative scenario | |
|---|---|
| Recommendation | SELL STOP |
| Entry Point | 61.45 |
| Take Profit | 60.50, 60.00, 59.44 |
| Stop Loss | 62.30 |
| Key Levels | 59.44, 60.50, 61.00, 61.50, 62.30, 63.04, 63.82, 64.42 |
Current trend
Brent crude oil prices have grown moderately since Tuesday, correcting after the "bearish" start of the week. The instrument is supported by not the strongest positions on USD, which is under pressure from ambiguous macroeconomic statistics, as well as news that the Fed has kept interest rates unchanged on January 30.
Oil quotes are supported by US sanctions against Venezuela’s state oil and gas company PDVSA, which has begun to renegotiate contracts with major importers. Part of the delivery may be terminated at all. Against this background, the API report, reflecting an increase in oil reserves in the US by 2.098M barrels, did not have a significant impact on the market.
The EIA Weekly Report supported the prices. For January 25, crude oil inventories grew by 0.919M barrels only, with the forecast of +3.100M barrels. The week before, the growth was 7.970M barrels.
Support and resistance
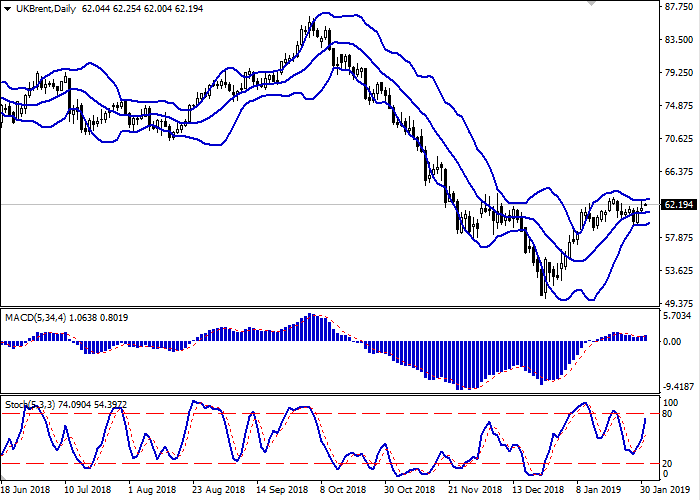
Bollinger Bands on the D1 chart demonstrate flat dynamics. The price range is slightly narrowing from below, reflecting the ambiguous dynamics of trading in the short term. MACD is growing, keeping a weak buy signal (located above the signal line). Stochastic grows more steadily but is approaching its highs, which reflects the overbought instrument in the ultra-short term.
To open new positions, one should wait for trade signals to become clear.
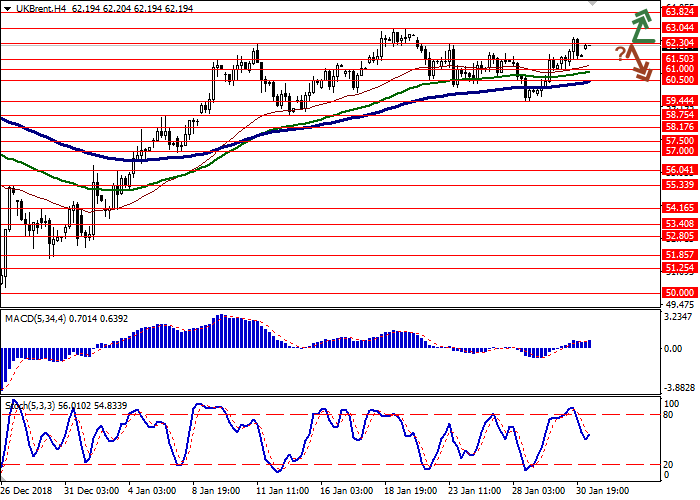
Resistance levels: 62.30, 63.04, 63.82, 64.42.
Support levels: 61.50, 61.00, 60.50, 59.44.
Trading tips
To open long positions, one can rely on the breakout of 62.30. Take profit — 63.82 or 64.00. Stop loss — 61.50. Implementation time: 1-2 days.
The rebound from 62.30 as from resistance with the subsequent breakdown of 61.50 can become a signal to begin correctional sales with target at 60.50, 60.00 or 59.44. Stop loss — 62.30. Implementation time: 2-3 days.
Brent crude oil prices have grown moderately since Tuesday, correcting after the "bearish" start of the week. The instrument is supported by not the strongest positions on USD, which is under pressure from ambiguous macroeconomic statistics, as well as news that the Fed has kept interest rates unchanged on January 30.
Oil quotes are supported by US sanctions against Venezuela’s state oil and gas company PDVSA, which has begun to renegotiate contracts with major importers. Part of the delivery may be terminated at all. Against this background, the API report, reflecting an increase in oil reserves in the US by 2.098M barrels, did not have a significant impact on the market.
The EIA Weekly Report supported the prices. For January 25, crude oil inventories grew by 0.919M barrels only, with the forecast of +3.100M barrels. The week before, the growth was 7.970M barrels.
Support and resistance
Bollinger Bands on the D1 chart demonstrate flat dynamics. The price range is slightly narrowing from below, reflecting the ambiguous dynamics of trading in the short term. MACD is growing, keeping a weak buy signal (located above the signal line). Stochastic grows more steadily but is approaching its highs, which reflects the overbought instrument in the ultra-short term.
To open new positions, one should wait for trade signals to become clear.
Resistance levels: 62.30, 63.04, 63.82, 64.42.
Support levels: 61.50, 61.00, 60.50, 59.44.
Trading tips
To open long positions, one can rely on the breakout of 62.30. Take profit — 63.82 or 64.00. Stop loss — 61.50. Implementation time: 1-2 days.
The rebound from 62.30 as from resistance with the subsequent breakdown of 61.50 can become a signal to begin correctional sales with target at 60.50, 60.00 or 59.44. Stop loss — 62.30. Implementation time: 2-3 days.


No comments:
Write comments