
XAG/USD: general review
10 November 2017, 09:06
| Scenario | |
|---|---|
| Timeframe | Intraday |
| Recommendation | BUY STOP |
| Entry Point | 17.13 |
| Take Profit | 17.35 |
| Stop Loss | 16.95 |
| Key Levels | 16.56, 16.63, 16.74, 16.86, 17.00, 17.10, 17.22, 17.35 |
| Alternative scenario | |
|---|---|
| Recommendation | SELL STOP |
| Entry Point | 16.80 |
| Take Profit | 16.63 |
| Stop Loss | 17.00 |
| Key Levels | 16.56, 16.63, 16.74, 16.86, 17.00, 17.10, 17.22, 17.35 |
Current trend
Prices for silver fell again, despite the fact that the US currency was under pressure amid news about tax reform in the US. In particular, investors drew attention to the possibility of deferred entry of a reduced corporate tax rate for one year. In addition, traders worry that most of the initiatives of the Republican Party will cause serious debate in the Senate and will not be accepted in the original version.
On Friday, November 10, there are no interesting macroeconomic statistics from the US, so the volatility is likely to remain the same. Corrective growth of the dollar may put additional pressure on the instrument, but there won’t be significant changes in the price dynamics.
Support and resistance
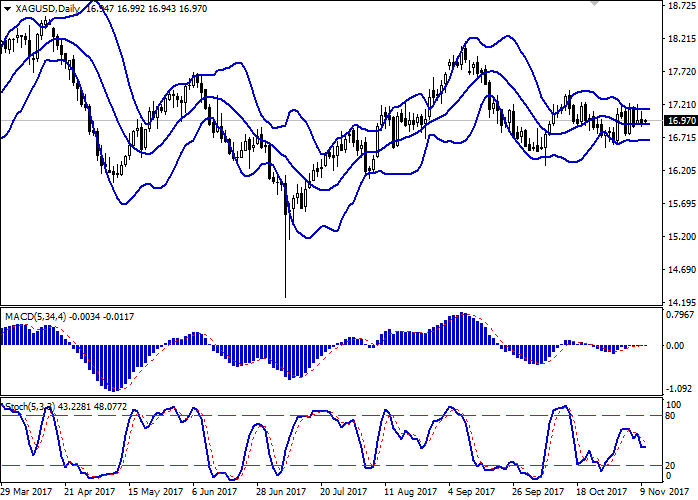
The MACD indicator has stretched in line near the zero mark, reflecting the flat moods on the market. Oscillator Stochastics shows a similar dynamics and often changes its direction. Bollinger Bands on the daily chart are almost horizontal. The price range does not change, reflecting the flat nature of the trades. Until further signals it’s better to stick to the channel strategy.
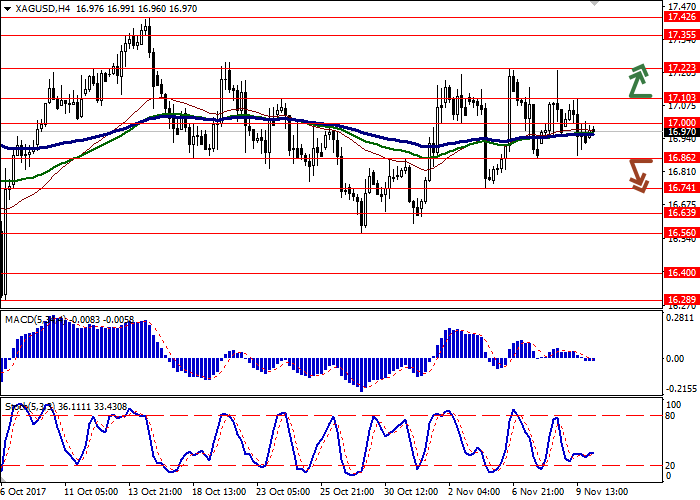
Resistance levels: 17.00, 17.10, 17.22, 17.35.
Support levels: 16.86, 16.74, 16.63, 16.56.
Trading tips
To open long positions, you can rely on the breakout of the level of 17.10. Take profit – 17.35. Stop loss is at 16.95. Term of realization: 2-3 days.
A confident breakdown of 16.86 can be a signal for further sales with a target of 16.63. Stop loss can be placed at 17.00. Term of realization: 2-3 days.
Prices for silver fell again, despite the fact that the US currency was under pressure amid news about tax reform in the US. In particular, investors drew attention to the possibility of deferred entry of a reduced corporate tax rate for one year. In addition, traders worry that most of the initiatives of the Republican Party will cause serious debate in the Senate and will not be accepted in the original version.
On Friday, November 10, there are no interesting macroeconomic statistics from the US, so the volatility is likely to remain the same. Corrective growth of the dollar may put additional pressure on the instrument, but there won’t be significant changes in the price dynamics.
Support and resistance
The MACD indicator has stretched in line near the zero mark, reflecting the flat moods on the market. Oscillator Stochastics shows a similar dynamics and often changes its direction. Bollinger Bands on the daily chart are almost horizontal. The price range does not change, reflecting the flat nature of the trades. Until further signals it’s better to stick to the channel strategy.
Resistance levels: 17.00, 17.10, 17.22, 17.35.
Support levels: 16.86, 16.74, 16.63, 16.56.
Trading tips
To open long positions, you can rely on the breakout of the level of 17.10. Take profit – 17.35. Stop loss is at 16.95. Term of realization: 2-3 days.
A confident breakdown of 16.86 can be a signal for further sales with a target of 16.63. Stop loss can be placed at 17.00. Term of realization: 2-3 days.


No comments:
Write comments