
WTI Crude Oil: general review
10 November 2017, 09:13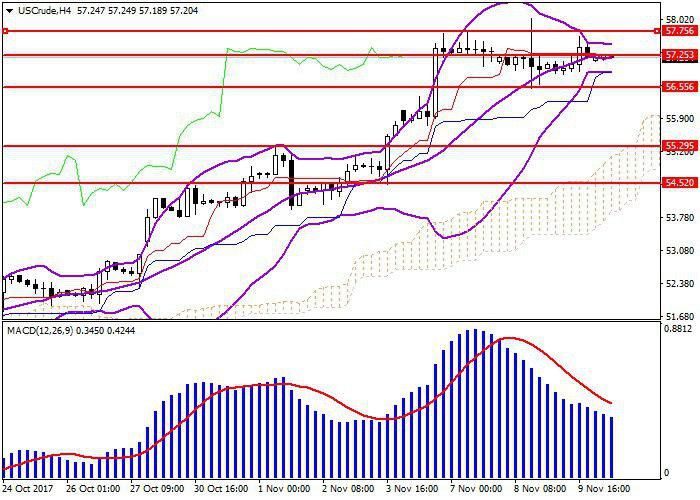
| Scenario | |
|---|---|
| Timeframe | Intraday |
| Recommendation | SELL STOP |
| Entry Point | 56.50 |
| Take Profit | 55.29 |
| Stop Loss | 56.90 |
| Key Levels | 54.52, 55.29, 56.55, 57.25, 57.75, 58.50 |
| Alternative scenario | |
|---|---|
| Recommendation | BUY STOP |
| Entry Point | 57.30 |
| Take Profit | 57.75, 58.50 |
| Stop Loss | 56.80 |
| Key Levels | 54.52, 55.29, 56.55, 57.25, 57.75, 58.50 |
Current trend
After the active growth of the previous days, quotes of WTI crude oil stabilized around the level of 57.25. The situation in the Middle East, where the conflict between Saudi Arabia and Lebanon is gaining momentum, as well as the positive expectations of investors regarding the prospects of the OPEC agreement to reduce world oil production keep the WTI rate at the two-year maximums, but this is not enough to continue the upward trend. The main event in the oil market for the near future will be reports from OPEC and IEA, scheduled for Monday and Tuesday.
Support and resistance
Technical indicators show a relative calmness in the market and lateral movement of the exchange rate: Bollinger bands are directed sideways; the MACD histogram volumes slowly decrease in the positive zone, but the indicator do not give a strong signal.
Support levels: 56.55, 55.29, 54.52.
Resistance levels: 57.25, 57.75, 58.50.

Trading tips
Short positions can be opened below the level of 56.55 with a target in the area of 55.29 and a stop loss at 56.90.
Long positions will become relevant above the level of 57.25 with a target in the area of 57.75-58.50 and a stop loss at the level of 56.80.
Term of realization: 1-3 days
After the active growth of the previous days, quotes of WTI crude oil stabilized around the level of 57.25. The situation in the Middle East, where the conflict between Saudi Arabia and Lebanon is gaining momentum, as well as the positive expectations of investors regarding the prospects of the OPEC agreement to reduce world oil production keep the WTI rate at the two-year maximums, but this is not enough to continue the upward trend. The main event in the oil market for the near future will be reports from OPEC and IEA, scheduled for Monday and Tuesday.
Support and resistance
Technical indicators show a relative calmness in the market and lateral movement of the exchange rate: Bollinger bands are directed sideways; the MACD histogram volumes slowly decrease in the positive zone, but the indicator do not give a strong signal.
Support levels: 56.55, 55.29, 54.52.
Resistance levels: 57.25, 57.75, 58.50.
Trading tips
Short positions can be opened below the level of 56.55 with a target in the area of 55.29 and a stop loss at 56.90.
Long positions will become relevant above the level of 57.25 with a target in the area of 57.75-58.50 and a stop loss at the level of 56.80.
Term of realization: 1-3 days


No comments:
Write comments