
USD/CHF: dollar is going down
10 November 2017, 08:57
| Scenario | |
|---|---|
| Timeframe | Intraday |
| Recommendation | BUY STOP |
| Entry Point | 0.9955, 0.9970 |
| Take Profit | 1.0000, 1.0035 |
| Stop Loss | 0.9930, 0.9900 |
| Key Levels | 0.9834, 0.9878, 0.9900, 0.9936, 0.9965, 1.0000, 1.0035 |
| Alternative scenario | |
|---|---|
| Recommendation | SELL STOP |
| Entry Point | 0.9890 |
| Take Profit | 0.9834, 0.9800 |
| Stop Loss | 0.9940 |
| Key Levels | 0.9834, 0.9878, 0.9900, 0.9936, 0.9965, 1.0000, 1.0035 |
Current trend
Yesterday US dollar significantly decreased against Swiss franc, renewing the minimum of October, 26, after the news upon new difficulties with the US tax reformation implementation. Among all, the markets are discussing the possibility of postponing of the implementation of the cut corporate tax rate. Senators are going to postpone the decision for one year.
In addition, dollar is under pressure of positives EU signals. According to Economic Bulletin, the EU economy growth in 2017 can exceed the expectation, made this spring. Current forecast supposes the EU GDP growth by 2.2% YoY, as the previous value was +1.7% YoY.
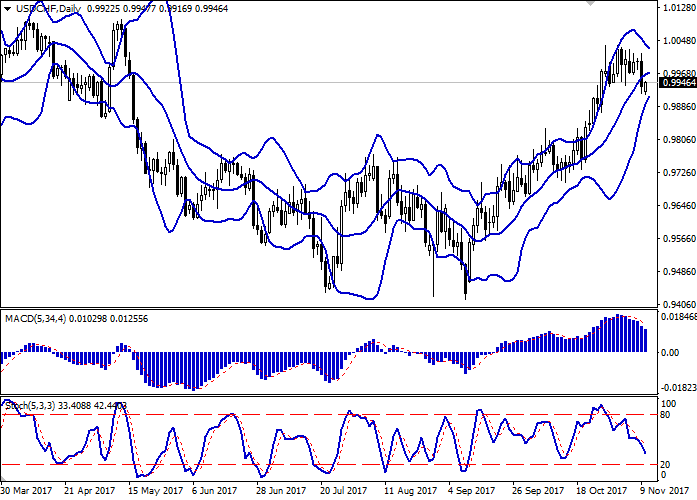
Support and resistance
On the daily chart Bollinger Bands are slightly reversing into flat. The price range is actively narrowing, reacting to yesterday’s rapid fall. It’s possible that the reversal model is developing.
MACD is going down, keeping steady sell signal (the histogram is below the signal line). It’s possible to keep current short positions and open new ones in the short and very short term.
Stochastic is going down, reaching the level of 20, which is formal border of the oversold area. The indicator doesn’t contradict with the “bearish” dynamics development in the very short term, but a real trend is unlikely to form in the short term.
Resistance levels: 0.9965, 1.0000, 1.0035.
Support levels: 0.9936, 0.9900, 0.9878, 0.9834.
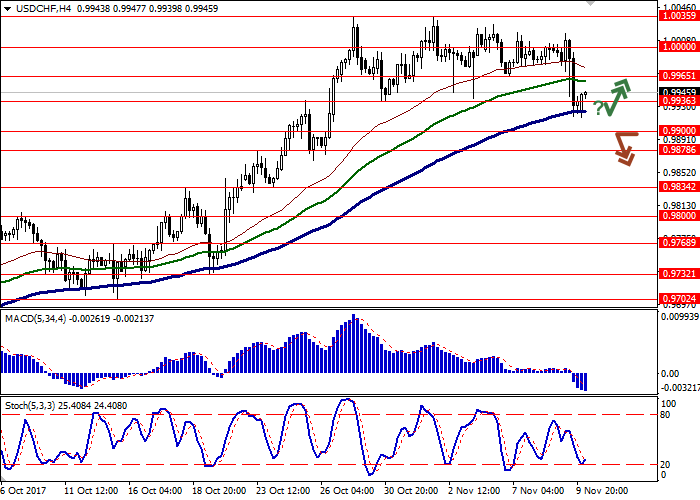
Trading tips
Long positions can be opened after the reversal around current levels and breakout of the levels of 0.9950-0.9965 with the targets at 1.0000-1.0035. Stop loss is around 0.9930-0.9900. Implementation period: 2-3 days.
The downward dynamics development with breakdown of the level of 0.9900 can be the signal of the full “bearish” trend development in the short term with the targets at 0.9834-0.9800 and stop loss at 0.9940. Implementation period: 2-3 days.
Yesterday US dollar significantly decreased against Swiss franc, renewing the minimum of October, 26, after the news upon new difficulties with the US tax reformation implementation. Among all, the markets are discussing the possibility of postponing of the implementation of the cut corporate tax rate. Senators are going to postpone the decision for one year.
In addition, dollar is under pressure of positives EU signals. According to Economic Bulletin, the EU economy growth in 2017 can exceed the expectation, made this spring. Current forecast supposes the EU GDP growth by 2.2% YoY, as the previous value was +1.7% YoY.
Support and resistance
On the daily chart Bollinger Bands are slightly reversing into flat. The price range is actively narrowing, reacting to yesterday’s rapid fall. It’s possible that the reversal model is developing.
MACD is going down, keeping steady sell signal (the histogram is below the signal line). It’s possible to keep current short positions and open new ones in the short and very short term.
Stochastic is going down, reaching the level of 20, which is formal border of the oversold area. The indicator doesn’t contradict with the “bearish” dynamics development in the very short term, but a real trend is unlikely to form in the short term.
Resistance levels: 0.9965, 1.0000, 1.0035.
Support levels: 0.9936, 0.9900, 0.9878, 0.9834.
Trading tips
Long positions can be opened after the reversal around current levels and breakout of the levels of 0.9950-0.9965 with the targets at 1.0000-1.0035. Stop loss is around 0.9930-0.9900. Implementation period: 2-3 days.
The downward dynamics development with breakdown of the level of 0.9900 can be the signal of the full “bearish” trend development in the short term with the targets at 0.9834-0.9800 and stop loss at 0.9940. Implementation period: 2-3 days.


No comments:
Write comments