
USD/CHF: instrument trades ambiguously
01 February 2019, 08:58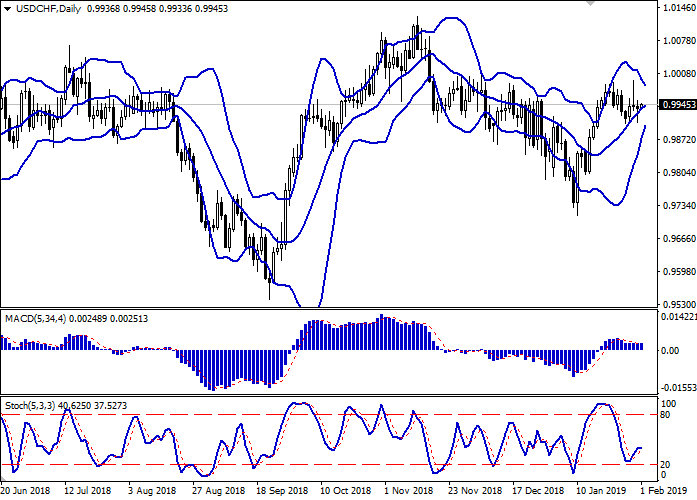
| Scenario | |
|---|---|
| Timeframe | Intraday |
| Recommendation | BUY STOP |
| Entry Point | 0.9970 |
| Take Profit | 1.0000 |
| Stop Loss | 0.9945, 0.9940 |
| Key Levels | 0.9847, 0.9871, 0.9904, 0.9933, 0.9962, 0.9980, 1.0000 |
| Alternative scenario | |
|---|---|
| Recommendation | SELL STOP |
| Entry Point | 0.9930, 0.9910 |
| Take Profit | 0.9871, 0.9847 |
| Stop Loss | 0.9950, 0.9962 |
| Key Levels | 0.9847, 0.9871, 0.9904, 0.9933, 0.9962, 0.9980, 1.0000 |
Current trend
Yesterday, USD was actively declining against CHF but almost completely recovered at the end of the daily session.
The market remains focused on the outcome of the Fed meeting. Investors were reassured by the intentions of the FOMC to keep patience before the next rate increase and carefully assess the situation. Jerome Powell noted that there were fewer arguments in favor of the rate hike, and the American economy suffered from the Shutdown, but suggested that all losses would be regained in Q2.
Also, investors follow the US-Chinese negotiations that opened yesterday and are awaiting the publication of the December data from the US labor market. The details of the negotiations were not disclosed, but it is known that President Donald Trump can join it.
On Friday, Nonfarm Payrolls will be published. The index may fall from 312K to 165K, but the data may be better than predicted, as evidenced by the positive ADP employment release published previously.
Support and resistance
On the daily chart, Bollinger bands are growing moderately. The price range narrows, reflecting the ambiguous trade nature in the short term. MACD fluctuates but still keeps a weak sell signal (the histogram is below the signal line). Stochastic is reversing into a horizontal plane after a short increase, indicating a decrease in upward corrective risks.
The current readings of technical indicators remain uninformative.
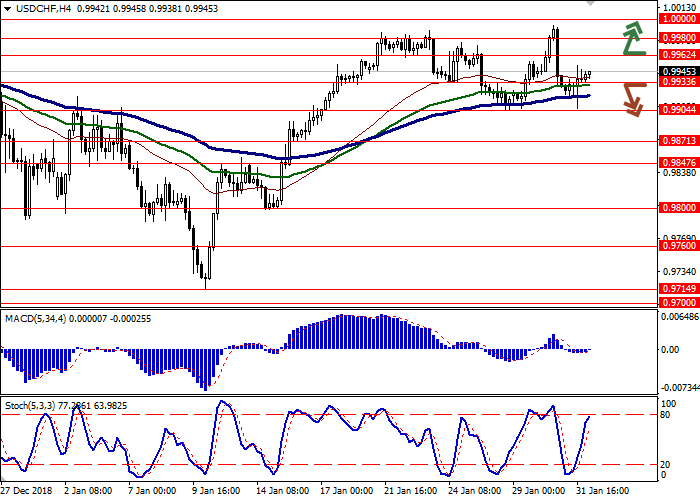
Resistance levels: 0.9962, 0.9980, 1.0000.
Support levels: 0.9933, 0.9904, 0.9871, 0.9847.

Trading tips
Long positions can be opened after the breakout of 0.9962 with the target at 1.0000. Stop loss is 0.9945–0.9940. Implementation period: 1–2 days.
Short positions can be opened after the breakdown of 0.9933–0.9915 with the targets at 0.9871–0.9847. Stop loss is 0.9950–0.9962. Implementation period: 2–3 days.
Yesterday, USD was actively declining against CHF but almost completely recovered at the end of the daily session.
The market remains focused on the outcome of the Fed meeting. Investors were reassured by the intentions of the FOMC to keep patience before the next rate increase and carefully assess the situation. Jerome Powell noted that there were fewer arguments in favor of the rate hike, and the American economy suffered from the Shutdown, but suggested that all losses would be regained in Q2.
Also, investors follow the US-Chinese negotiations that opened yesterday and are awaiting the publication of the December data from the US labor market. The details of the negotiations were not disclosed, but it is known that President Donald Trump can join it.
On Friday, Nonfarm Payrolls will be published. The index may fall from 312K to 165K, but the data may be better than predicted, as evidenced by the positive ADP employment release published previously.
Support and resistance
On the daily chart, Bollinger bands are growing moderately. The price range narrows, reflecting the ambiguous trade nature in the short term. MACD fluctuates but still keeps a weak sell signal (the histogram is below the signal line). Stochastic is reversing into a horizontal plane after a short increase, indicating a decrease in upward corrective risks.
The current readings of technical indicators remain uninformative.
Resistance levels: 0.9962, 0.9980, 1.0000.
Support levels: 0.9933, 0.9904, 0.9871, 0.9847.
Trading tips
Long positions can be opened after the breakout of 0.9962 with the target at 1.0000. Stop loss is 0.9945–0.9940. Implementation period: 1–2 days.
Short positions can be opened after the breakdown of 0.9933–0.9915 with the targets at 0.9871–0.9847. Stop loss is 0.9950–0.9962. Implementation period: 2–3 days.


No comments:
Write comments